The Universal Analytics (Google Analytics 3) era is coming to an end, and the clock ticking it down can’t be stopped. This is all due to the latest version of the tool for tracking and measuring user activity on a website – the next chapter of web analytics in the Google ecosystem is called Google Analytics 4.
What is GA4?
Google Analytics 4 is mainly a response to the lack of a single, cohesive environment for analyzing user behavior through different types of devices. Until now, a unified measurement of actions and behaviors on both apps and websites was impossible. However, we are now entering a new world of measurement, all from one common dashboard.

History of web analytics: Google Analytics version history
When the Urchin Software Corporation was founded in 1995, no one could have predicted that 10 years later it would become part of Google. In 2005, under the name Urchin Analytics (GA1), a tool for tracking user activity on a website was created. Google needed over a year from the start of the project to make the tool available to all users, regardless of whether they use Google tools for advertising or not.
From today’s perspective, some could say that nothing lasts forever in Google – or at least not for a long time. In 2007, Google finally removes the Urchin fragment from the name and introduces a new standard for measuring user behavior: Classic Analytics (GA2). However, this change was not purely cosmetic. The previous version of the tool slowed down page loading and had a negative impact on its performance. Meanwhile, Classic Analytics was called an asynchronous tracking code – it was supposed to be more sensitive and accurate than its predecessor.
GA2 leads the analytical environment until 2012. In October 2012, Google announces the introduction of another version of the tool called Universal Analytics (UA / GA3), whose main advantages over its predecessor are:
- navigation dashboards,
- custom reports,
- real-time analytics.
But the real game changer is the introduction of tracking on multiple platforms, collecting data from any device, and creating custom dimensions and metrics.
In March 2016, Google creates Google Analytics 360, which includes:
- Google Analytics 360,
- Google Tag Manager 360,
- Google Optimize 360,
- Google Data Studio 360,
- Google Attribution 360,
- Google Audience Center 360.
They were supposed to improve the analysis of ROI and other key marketing indicators.
In 2017, we are introduced to the world of a unified tagging system – Google announces a new version of the Google Analytics tag called Global Site Tag, which is already a clear signal that measuring and tracking behavior on multiple platforms is not easy to implement and… it’s time to make changes. Under the name Google Analytics App+Web, Google allows analysts into the Beta environment and develops an even simpler, yet more powerful tool for tracking and analyzing user behavior across all platforms, even those that are not web-based.
In 2020, Google Analytics 4 (GA4) comes out of beta, and the official producer’s recommendation is dual tagging. Nothing extraordinary, except for the fact that Google announces the definitive closure of the Universal Analytics (GA3) project in July 2023. At the time of writing this article, the recommendation has changed to GA4 First Tagging, but still with simultaneous tracking in the Universal Analytics version.

Why GA4?
Google Analytics 4 is currently the default standard for tracking when configuring new services in the Google Analytics tool. The reason for the change is the continuous evolution of customer behavior and the need to keep up with changes in measuring marketing effectiveness while respecting user privacy on the internet.
Changes in customer behaviour
- They are aware of the competition’s phenomenon on the Internet.
- They buy increasingly consciously, thanks to greater availability of information and the ability to compare offers.
- The purchase process is often stretched in time and also takes place using multiple devices at the same time.
Changes in measuring behavior in relation to GA3
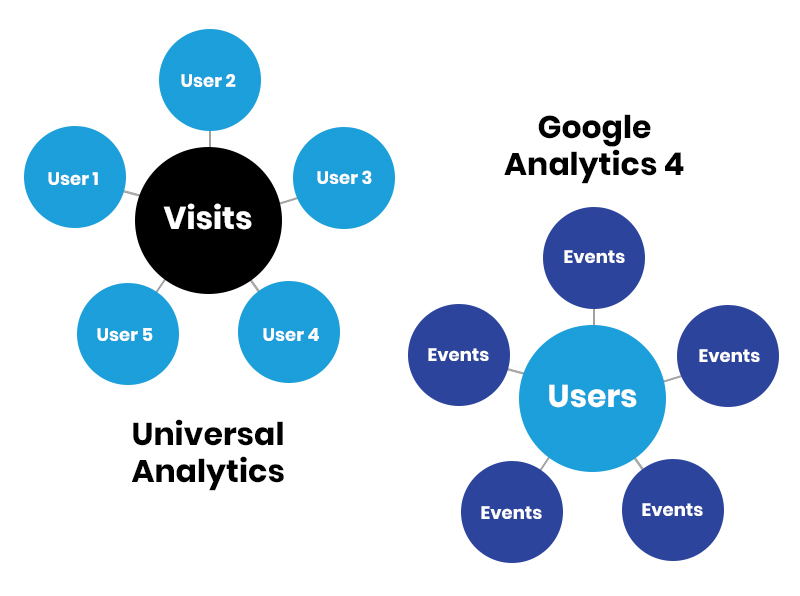
- Universal Analytics (GA3) collects data on the same users in a fragmented manner, while in GA4 all data flows into one cohesive aggregator, which speeds up cross-data analysis of users.
- GA3 allowed data to be combined using the User-ID function, but only within browsers, leaving out data from applications. In GA4, using the same User-ID, we collect information about both Web events and those coming from Applications.
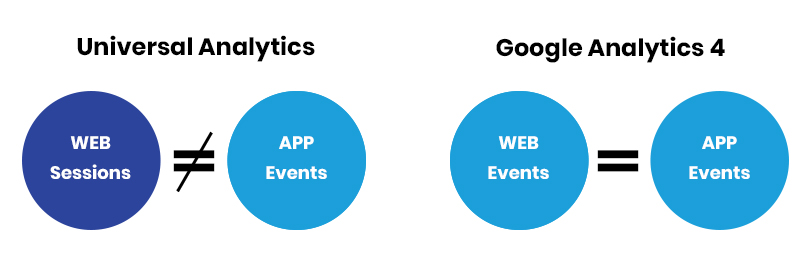
- In GA3 the WEB version measured Sessions, and the APP version measured Events. In GA4 both these versions are used to measure Events.

What GA4 has to offer?
Primarly, it enables the collection of data on users. This process can be illustrated as follows:
A. The user visits our website using a browser of their choice.
B. When the user enters the site, the tracking code implemented on the site starts collecting data on the user’s activities.
C. At the same time, a fragment of code (cookie) is placed in the browser’s memory.
D. If the user enters the site for the first time, thanks to the cookie, it is known that it is a returning user and not a new user. These are called first-party cookies, which are safe and considered a standard for exchanging anonymous data on user behavior between the site and the publisher of the cookie (Google).
E. Data is dynamically transferred to GA servers, where it is processed and then presented in the form of reports in the GA panel.

On the other hand, GA4 allows us to review and analyze previously collected data in the form of reports and visualizations, using a single cohesive space. For example, sessions are replaced with events, and these are in one set between selected data sources. With a single panel, it is much easier to analyze screen views for mobile apps and page views for websites. Furthermore, reports generated using GA4 focus on behaviors and the number of unique users in all marketing channels, both on websites and in mobile apps. All of this allows for a better understanding of the implementation of business strategies, customer interactions with the brand and allows for effective analysis of business touchpoints with users.
If you’re wondering how to customize GA4 reports, go to our guide on GA4 reports.
What are the most important differences between GA4 and GA3?
One of the reasons why Google Analytics had to make a revolutionary change in the way it measures user behavior was the lack of a common denominator between desktop and mobile devices:
- On websites, we have Cookies and signals from the site (Hits) aggregated in the form of sessions, or visits.
- In apps, we use the device identifier and events, which are all actions that occur while the device is being used by the user.

Google Analytics 4 allows you to set the default reporting identity on more than one way. The result of using the full user identification feature is the ability to analyze at many levels:
- Cookie ID – first-party Cookies (Device ID in the case of mobile); data from Cookies were never an ideal source of information;
- Google Signals – anonymous data collected in other tools used by the user;
- Signed-in/registered users.
- To be able to use the full range of reporting identity, you only need to activate the following GA settings:
- Implement the User-ID function on the website, which allows identifying unique users using a unique identifier.
- Turn on the option to use Google Signals in our GA4 service (preferably during configuration).
Without turning on User-ID and Google Signals, data will still be collected, but in the form as in Universal Analytics, so we will not use the new possibilities offered by GA4 fully.
With this new approach and tool, we can:
- Collect user data more accurately,
- Measure their entire conversion path regardless of the devices and platforms used,
- Make more effective strategic decisions and better plan promotional activities,
- Focus on effectively researching customer relationships rather than just the quantity of products sold,
- Measure Lifetime Value, which was not possible with the classic GA3 version.

In GA3, the focus was on individual user visits rather than the quantity and quality of users. In GA4, the focus is on users – all data about events is collected around them. Modern marketing should primarily focus on acquiring valuable users and maintaining a long-term relationship with them, not just on the number of transactions.
Customer Centric > Product Centric

Account structure: GA3 vs GA4
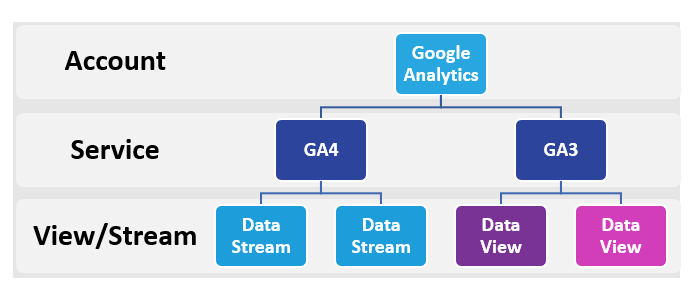
In GA, the account serves only an administrative role, while its main focus are the services that collect and process data. Currently, both GA4 and GA3 are available on a Google Analytics account, but eventually, only the GA4 service will remain.

In GA4, each account consists of various GA4 services, which are divided into data streams. These streams flow from the Web and iOS or Android app platforms. In the past, with GA3, data was collected based on a single platform, the Web, and the service division was created based on views of data from a single source. This change is considered the most revolutionary among the others that the new generation of GA has introduced.
Dual Tagging
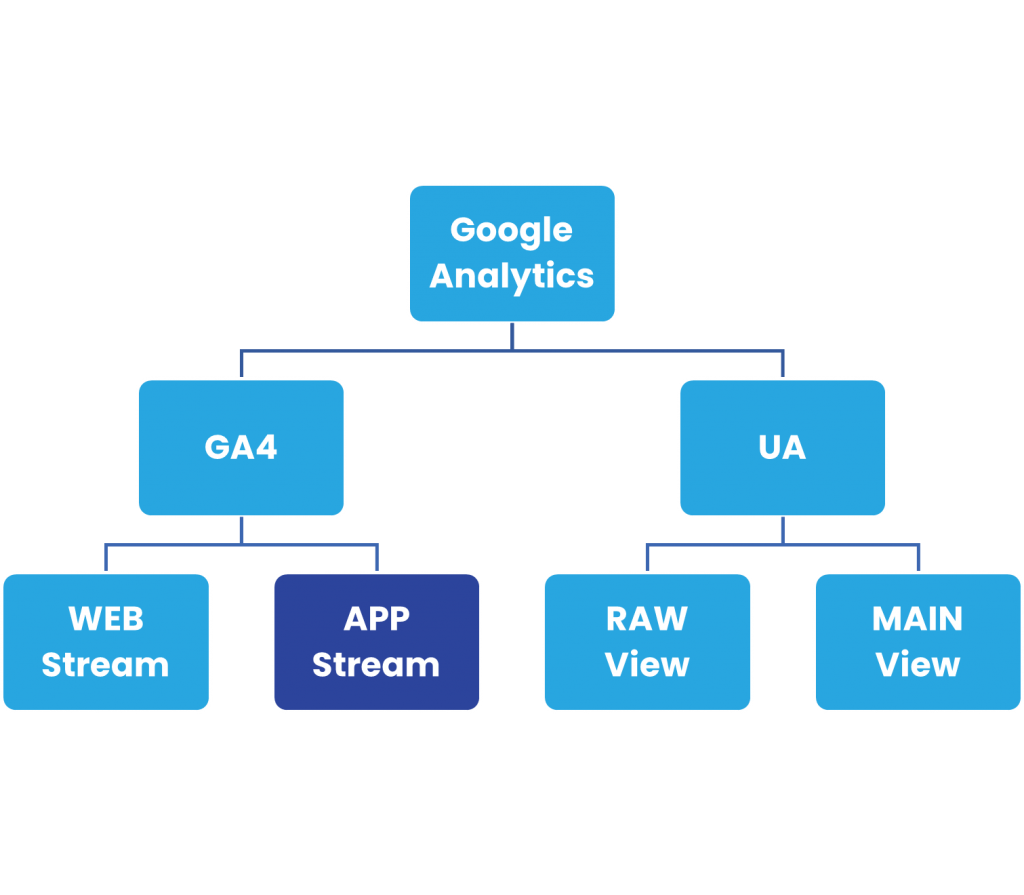
At the time of writing this article, both services (GA4 and GA3) can be implemented through GTM in an easy way, but ultimately only GA4 will remain (the deadline provided by Google is July 2023). For a given business unit (e.g. domain) with active two services on one account, we have:
- Web data stream,
- RAW data view,
- Filtered data view.

With Google Analytics 4, analytics becomes simpler and more transparent. A new approach to data is shaping up, according to which all decisions must be Data-Driven – and rightly so. GA4 provides even more information and insights for analysis, especially important for businesses operating online both in the “web” and “app” version. The new generation of this service relates to user data, not just their sessions, so analytics enters into a space that has been difficult to access or impossible to manage until now.
The use of Google Analytics 4 allows the analysis of user behavior and points of contact with the business, who use multiscreening and multichanneling in everyday life. This service allows cooperation between the GA3 and GA4 worlds, which translates into easy entry and allows testing GA4 capabilities in combination with processing data in a way familiar to the GA3 interface.
Summary: Future of Web Analytics with Google Analytics 4
Connecting GA4 codes is necessary in the future, even if we currently do not see the need to test the new version of analytics from Google. However, it should be remembered that as of July this year, Google will no longer support the Analytics older version, and GA4 will fully replace its predecessor. In July 2024 GA4 will also replace GA360, therefore, it is worth collecting data for future analysis, so as not to lose ground when making the final transition to GA4.
FAQ
Why google analytics 4?
Google Analytics 4 is now the default standard as it adapts to evolving customer behavior, measures marketing effectiveness more accurately, and respects user privacy online.
How to implement Google Analytics 4?
Here are four methods for implementing Google Analytics:
1. Google Tag Manager - using GTM without additional plugins or dataLayer. Trigger tags based on GTM rules, such as scrolling the page or interacting with video.
2. Plugins - offered by most e-commerce systems or CMSs for tracking Google Analytics. The effectiveness of plugins may vary depending on the store.
3. dataLayer + tags in GTM - Collaborate with a developer to implement dataLayer and use tags in Google Tag Manager.
4. DOM scraping - You can use JavaScript scripts to extract data from the HTML structure of the page.
Does Google Analytics 4 measure pageviews when implemented?
Yes, Google Analytics 4 measures pageviews. In the GA4 data model, the equivalent of pageviews from Universal Analytics is the "page_view" event, which is automatically recorded. For apps, the equivalent is the "screen_view" event. The number of registered impressions in both services should be similar, to within a few percentage points.
What are dimensions in Google Analytics, and what are metrics?
In Google Analytics, dimensions are data attributes, such as City, which indicates where a session came from, or Page, denoting the URL of the page displayed. Data, on the other hand, are quantitative measurement results - for example, the number of sessions, or the average number of pages viewed during a single site visit.


