Although it’s been a while since we made the transition to 100% reporting with Google Analytics 4 (GA4), there’s still a lingering nostalgia for the days of Universal Analytics. This sentiment isn’t just about the need to shift our data collection approach; it’s also rooted in our attachment to the familiarity of the old interface. But fear not, because, in this article, we’ll explore how to customize the appearance of this new tool and transform GA4 into a user-friendly everyday work environment. Let’s dive into these essential topics.
Tailor reports to your needs
Standard reports are created to meet general user requirements. However, it’s important to remember that you can, and sometimes should, adapt them to your specific needs. In GA4, you have the flexibility to modify the following:
- Overview reports
- Detailed reports
- Predefined reports
- Report library
This level of customization far exceeds what was possible with the beloved Custom Reports feature in Universal Analytics. In the following sections, I’ll briefly describe the changes that can be introduced at each of these levels.
Overview reports
Overview reports, often referred to as summaries, are essentially summary cards created within detailed reports when editing or creating reports from scratch in GA4.
To customize an overview report, ensure you have at least the Editor role in GA4. Simply click “Customize Report” when you are in a specific report or choose “Create New Report” in the Report Library:
Navigation
Go to the „Report Library” -> above the list of reports, click on “Create new report”.
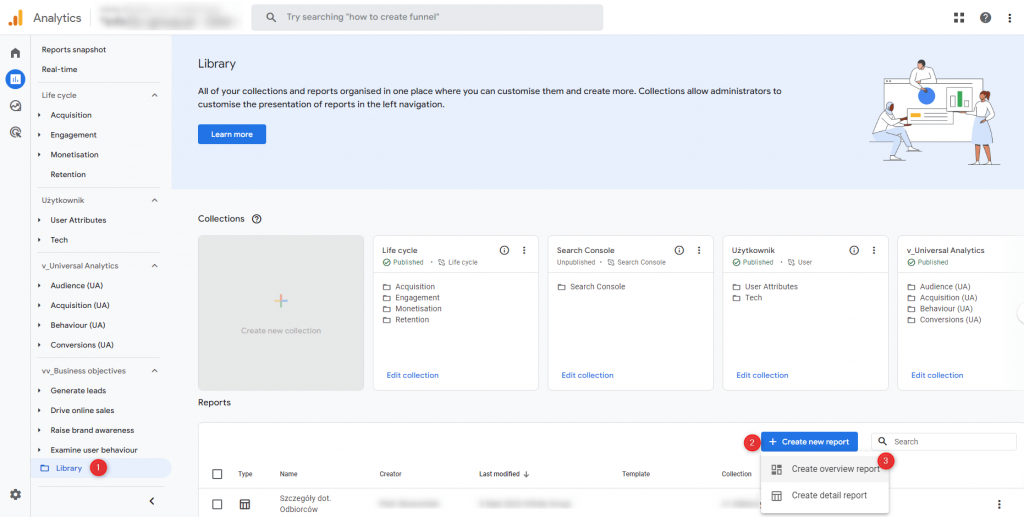
The Overview Report Wizard has two sections: “Cards” and “Report Template”. After clicking “Add cards”, you can select previously defined summary cards based on detailed reports. Reports created from scratch are disconnected from templates by default and cannot be linked. Once you have finished making changes or configuring your new report, click “Save” as a new report, provide a “Name” for the new report, and click “Save” again.
Reports Snapshot
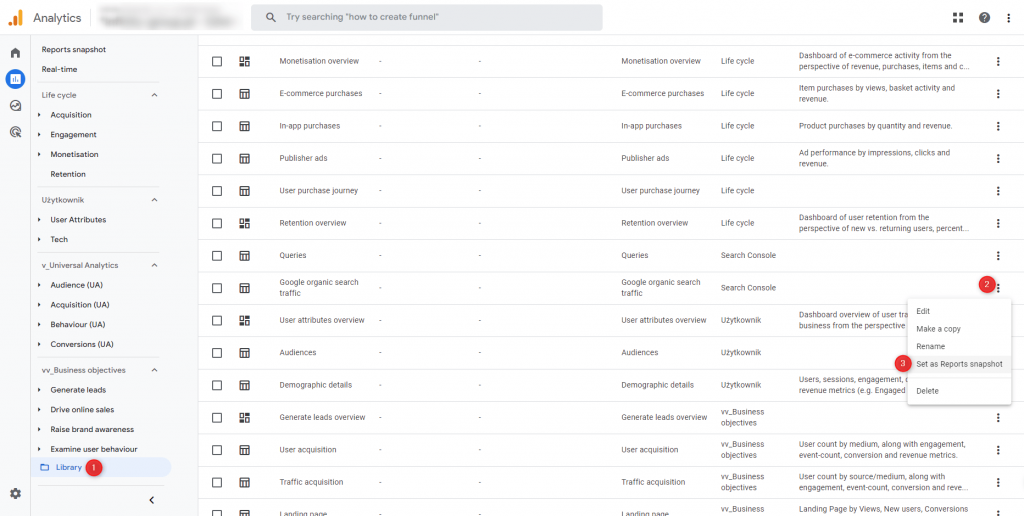
To see key data immediately after clicking the Reports tab in the sidebar, after creating an overview report, you can set it to “Reports Snapshot”:
Navigation
Go to “Report Library” -> in the list of reports, search for an “Overview” report -> click “More” -> select “Set as “Reports Snapshot”.
Detailed reports
Detailed reports in GA4 come with default visualizations in two formats. The initial part includes charts providing a comprehensive data overview, while the second part offers a detailed data table for in-depth analysis.To personalize a detailed report, ensure you have a minimum of an Editor role within GA4. Access customization options by clicking on “Customize Report” within a specific report or by creating a new report in the Report Library:
Navigation
Go to the “Report Library” and click “Create new report” located above the list of reports.
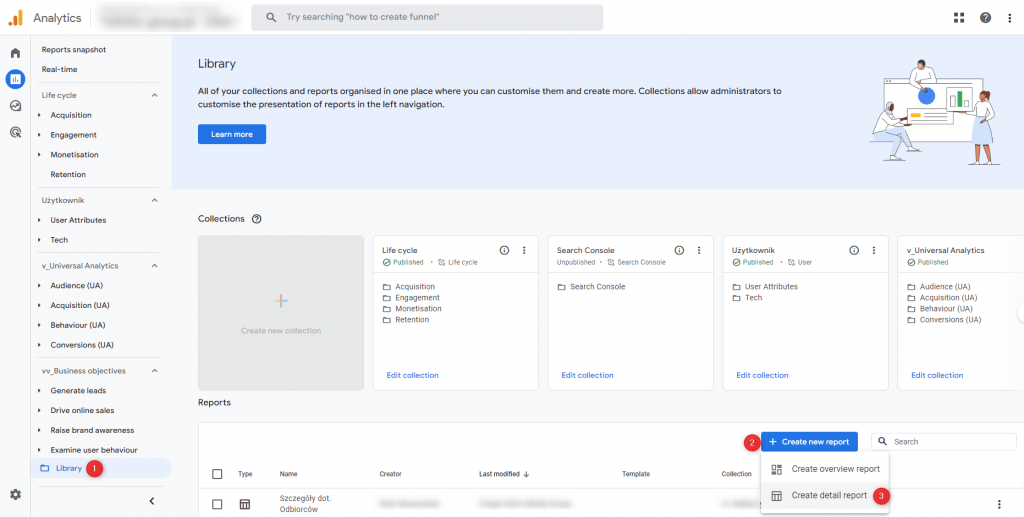
The Detailed Report Builder comprises several sections, including Dimensions, Metrics, Charts, Filters, Summary Cards, and Linking to a Template. After making changes to the data sections, be sure to click “Apply” to update the working report view.
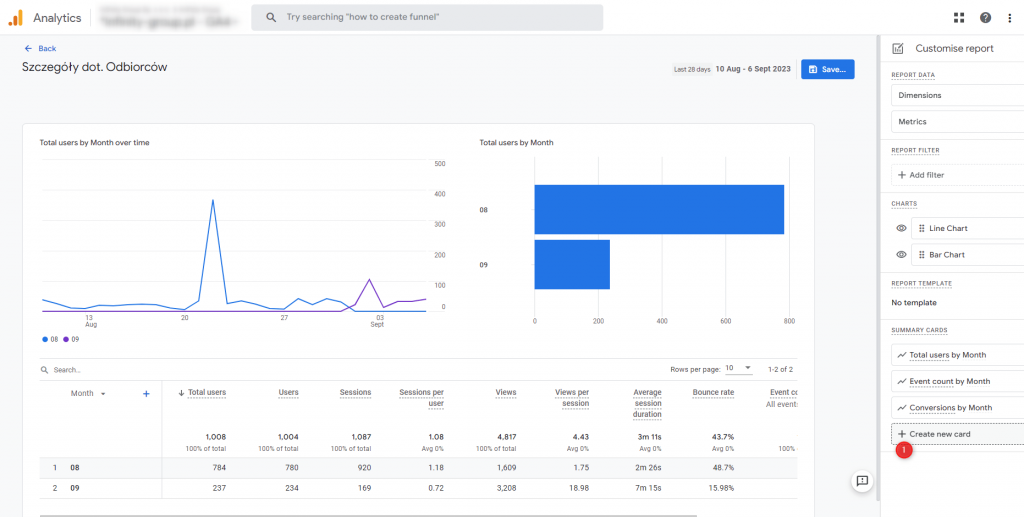
To create summary cards for overview reports, select “Create New Card” while editing a detailed report.
Navigation
Click “Create a new card” located in the right sidebar -> Choose from the available report data options, including “Dimensions,” “Metrics,” “Visualization,” and “Filters” -> Click “Apply” to confirm your selections.
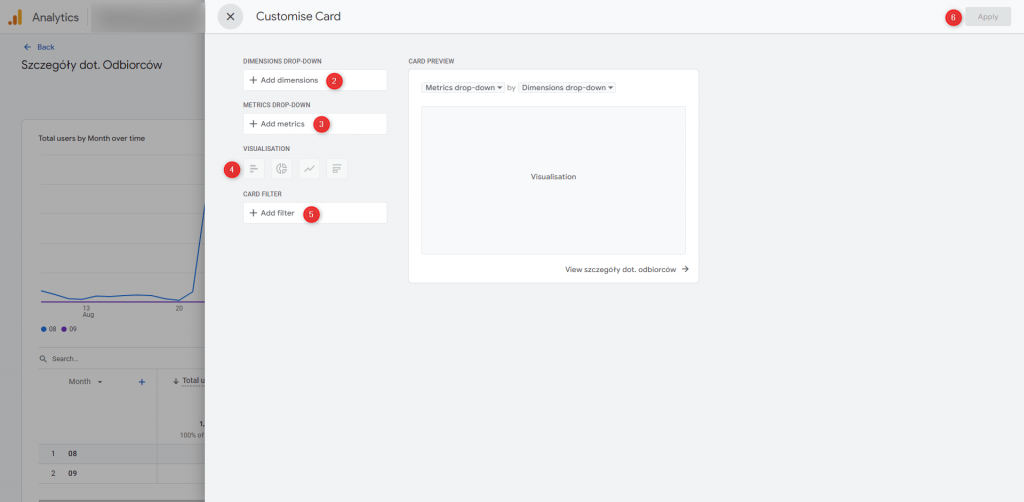
Reports created from scratch are, by default, independent of templates and cannot be linked.
After completing your changes or configuring your new report, click ‘Save’ to save it as a new report. Provide a ‘Name’ for the new report and click ‘Save’ once more to confirm.
Predefined reports
Predefined reports, also referred to as report collections, are categorized into two main types: Overview Reports (providing data summaries from detailed reports) and Detailed Reports (presenting data based on GA4 service configuration).
To personalize predefined reports according to your requirements, you need to have, at the very least, an Editor role in GA4. Customize a specific predefined report by clicking “Customize Report.”
Navigation
Go to the “Reports” section -> Select the report of your interest -> Click “Customize” located in the upper right corner of any report.
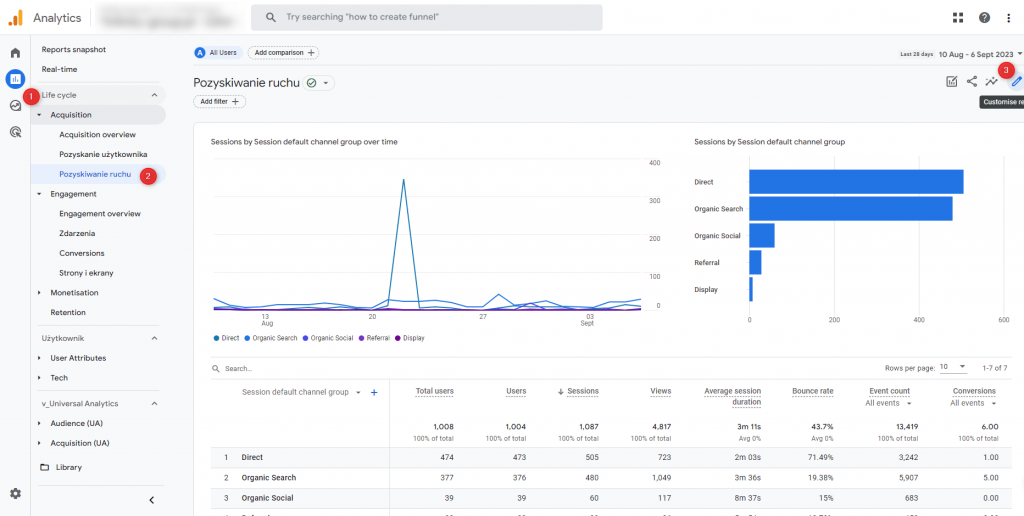
As you’re aware, overview reports comprise ‘Summary Cards’ created during the customization of detailed reports. The following steps detail the editing process for all sections of the Detailed Report Wizard.
Dimensions and Metrics
To tailor the table dimensions and metrics selector:
Navigation
Within the report data section, choose either “Dimensions” or “Metrics” -> Click “Add” for the desired dimension or metric, then select the appropriate metrics -> Finally, click “Apply”.
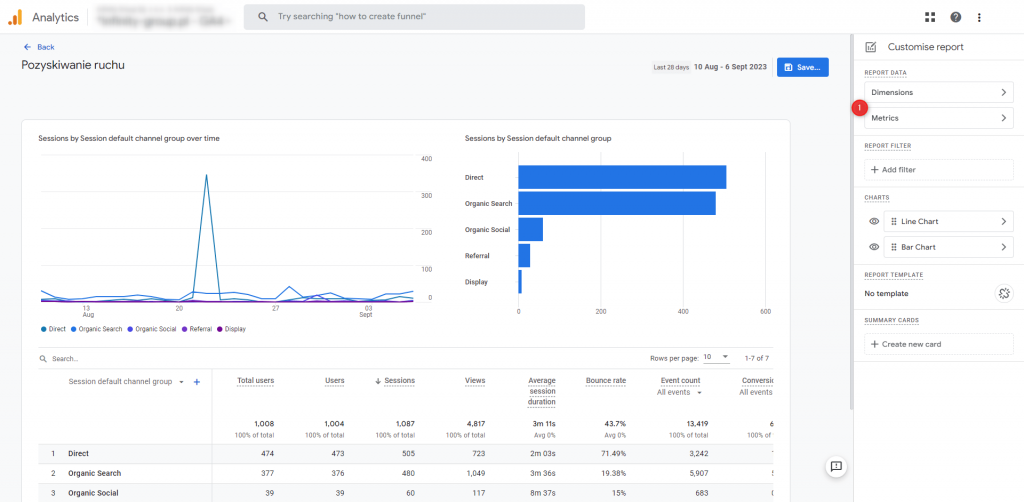
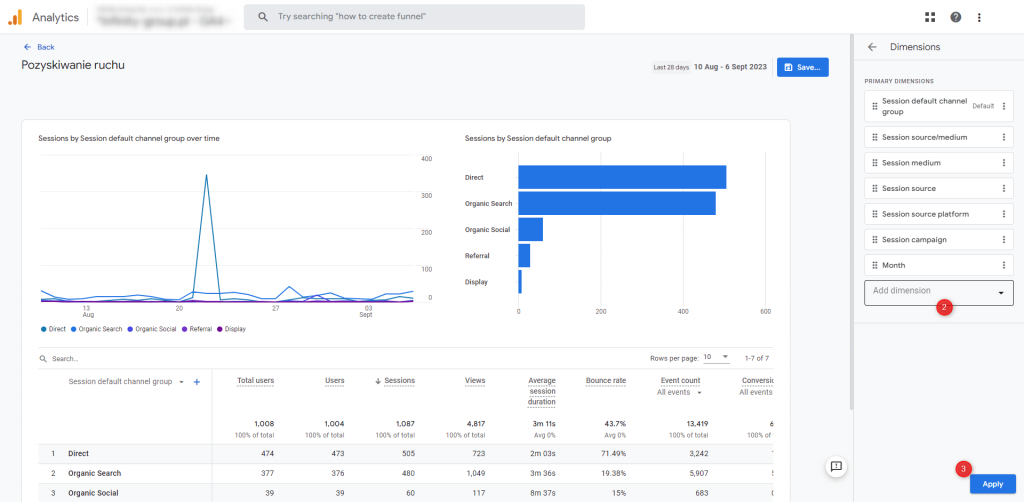
Additional Editing Actions:
- To remove a dimension or metric, click “Delete” next to the dimension or metric.
- To designate a dimension or metric as the default, click “More” and then “Set as Default.”
- To rearrange the order of dimensions or metrics in the list, simply click on the data, drag, and drop.
- To specify the default table sorting, click the “arrow” next to the metric you wish to use for sorting.
Filters
When editing predefined reports, you have the option to add filters that become a permanent part of the report’s configuration upon saving.
To apply a filter to a report, follow these steps:
Navigation
In the report filter section, click “Add Filter” -> In the Conditions section, click “Select Dimension” -> (Optional) Click “Add New Condition” to create up to 5 conditions in total -> Select at least one dimension value -> Click “Apply”.
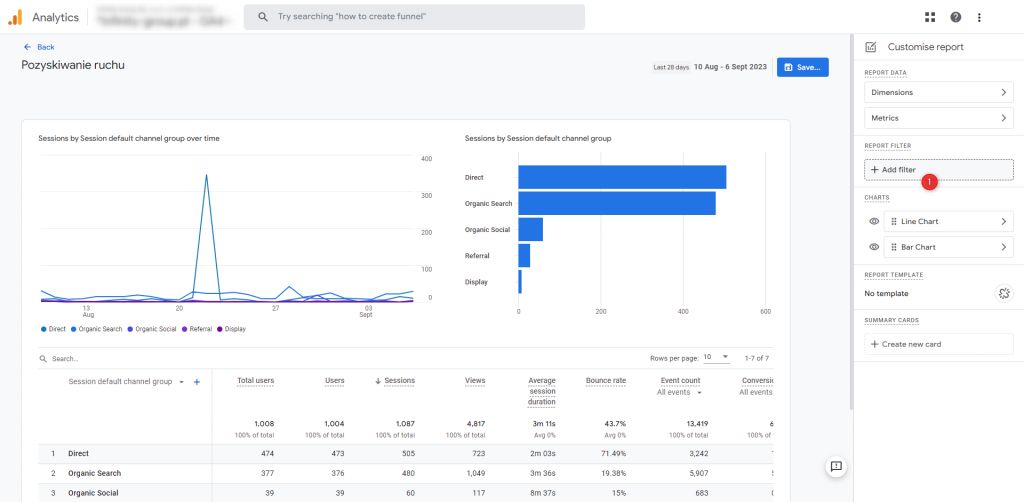
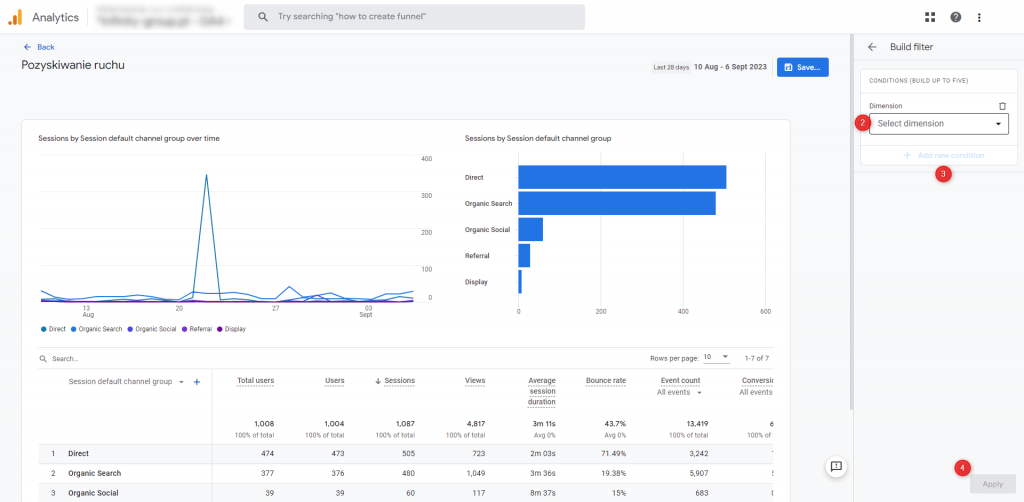
Report Filtering Notes:
- When you select multiple conditions, keep in mind that each condition must be true because Google combines conditions using the AND operator.
- If you encounter an “inactive” dimension in the list, it indicates that this dimension is incompatible with other dimensions in the report.
Charts
To customize charts in the first half of the report, follow these steps:
Navigation
In the “Charts” section, click “>” -> Choose the desired chart type (line, bar, scatter) -> Click “Apply”.
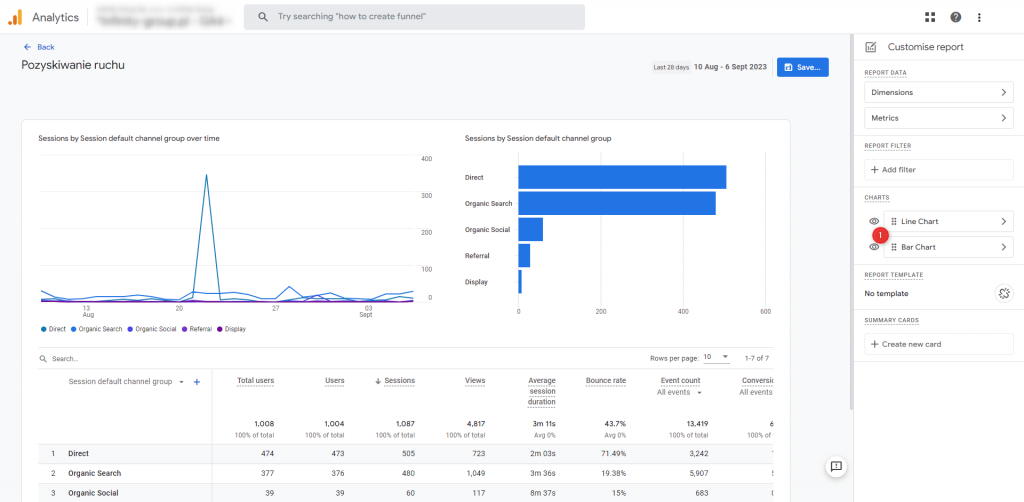
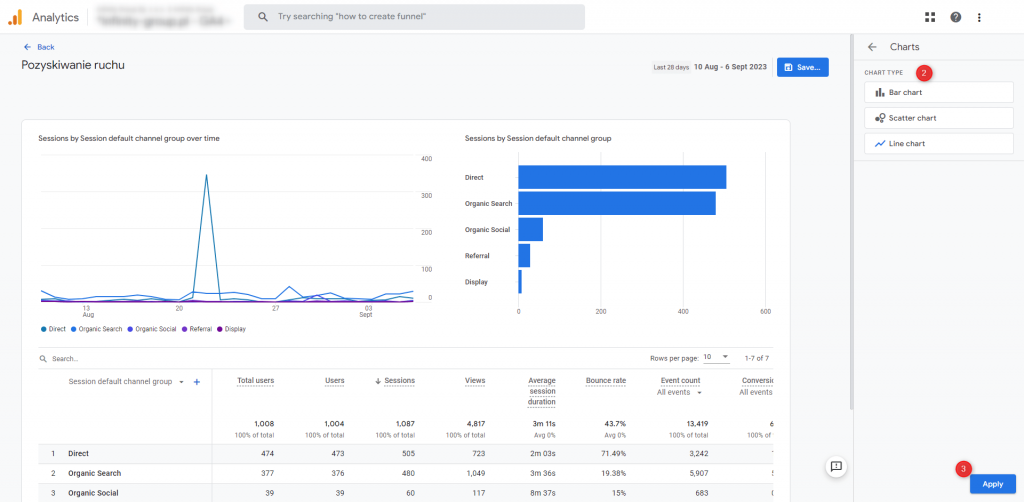
Additional Editing Actions:
- To hide a chart, simply click the “eye” icon next to the respective chart.
- To rearrange the order of charts in the report, click a chart and drag it to your desired position.
Templates
When working with predefined reports, you have the option to use report templates. This allows your report to stay in sync with any updates Google makes to the report template, ensuring that these changes are reflected in your report. It’s worth noting that these updates won’t affect any changes you’ve made to the report itself.For reports created from scratch, they are, by default, separate from templates and can’t be linked. If you prefer that the predefined report remains unaffected by template updates, you can choose to detach it from the template.
Navigation
In the “Report Templates” section, simply click “Unlink from template” -> Then, click “Save” report to make these changes.
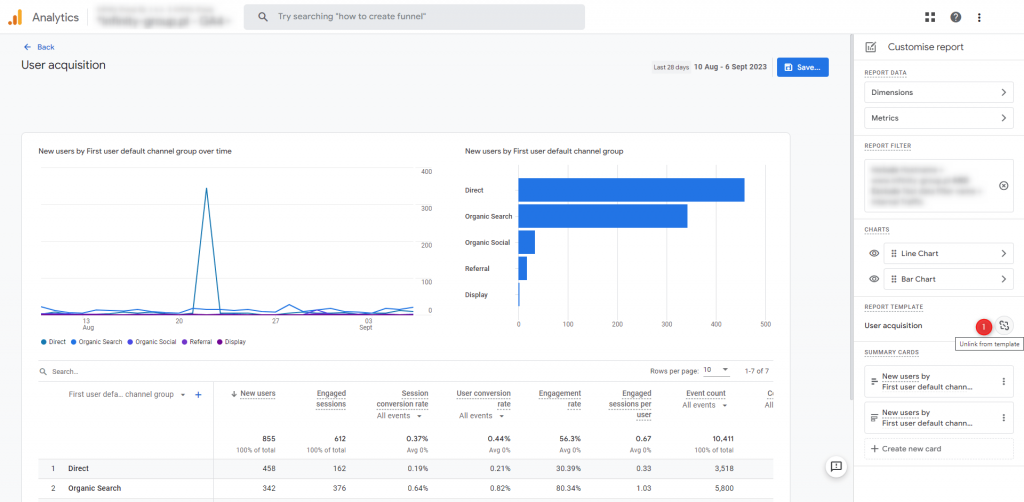
After saving changes to the report, be aware that disconnected objects cannot be reconnected.
Summary cards
To customize your summary cards and be able to select cards in your overview report, follow these steps.
Navigation
In the “Summary Cards” section, click “Create New Card” -> select the “Dimensions”, “Metrics” you want to add -> select the visualization “Type” (line, pie, bar, table) -> (Optional) add “Filters” -> click “Apply”.


- If the detailed report is part of a collection, you’ll find the cards in the “Summary Cards” tab.
- If the detailed report doesn’t belong to any collection, you will find the created cards in the “Other cards” tab.
Once you have finished making changes or configuring your new report, click “Save” as a new report, provide its “Name,” and click “Save” again.
Report library
The Report Library is the central hub for managing collections, topics, and reports in the “Reports” section of GA4. If you have at least editor access to the service, you’ll find access to the report library conveniently located in the lower-left corner of the Reports section.
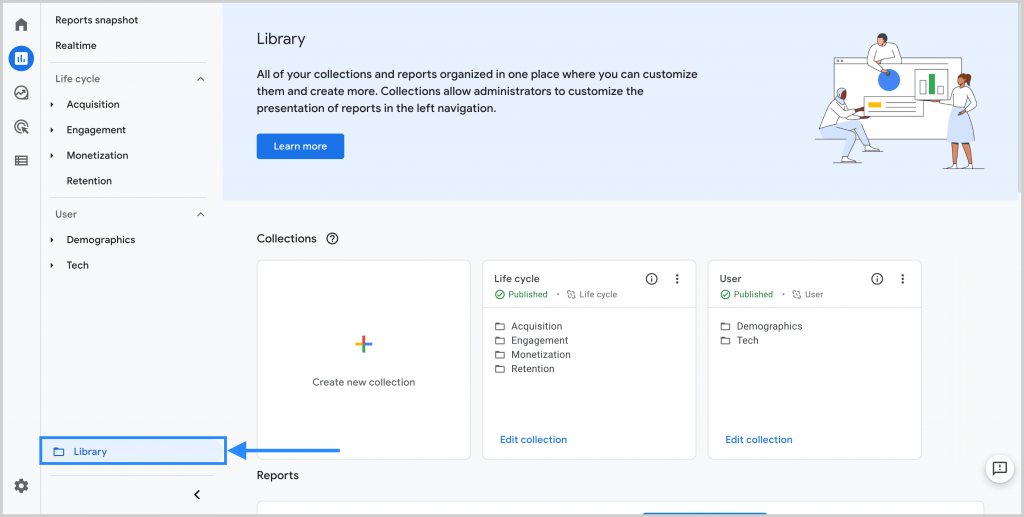
The Report Library comprises two main components:
- Collections: This section enables you to choose collections, topics, and reports to be displayed in the left sidebar of the GA4 panel. For a set of reports to be visible, they must be published to collections.
- Reports: In this section, you can manage reports within the GA4 service. Here, you have the flexibility to create reports from scratch, customize existing reports, or generate duplicates of both overview and detailed reports based on predefined reports.
Collections
To create a collection, you must have at least the Editor role in GA4. Follow these steps:
Navigation
In the left sidebar of the Reports section, click “Library” > Click “Create New Collection” -> Choose “Blank Option” to start creating the collection or select a predefined “Template” for the collection -> Enter “Collection Name” -> Click “Create New Topic” as the collection header -> Click “Apply” -> Select a detailed report and drag it to the collection -> Select an overview report and drag it to the collection -> Click “Save” to save the collection.
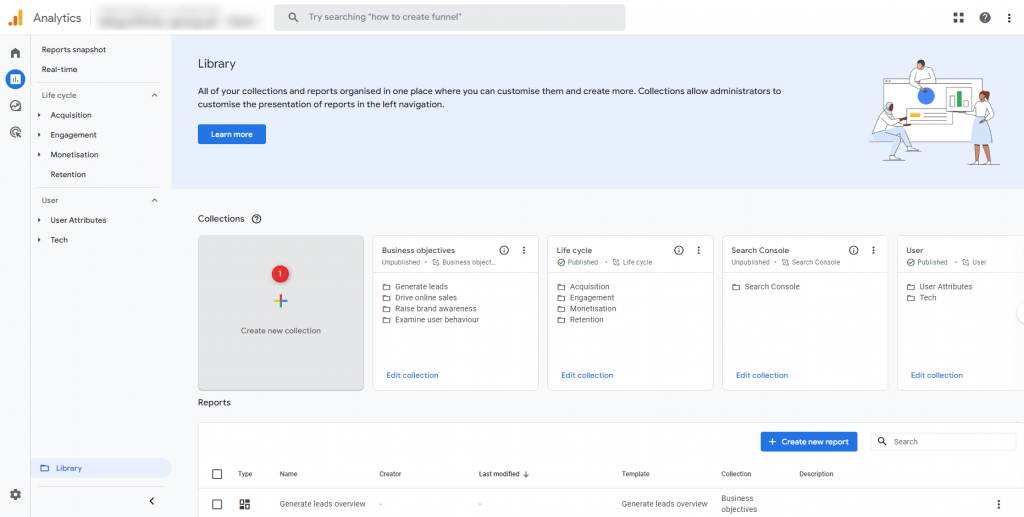
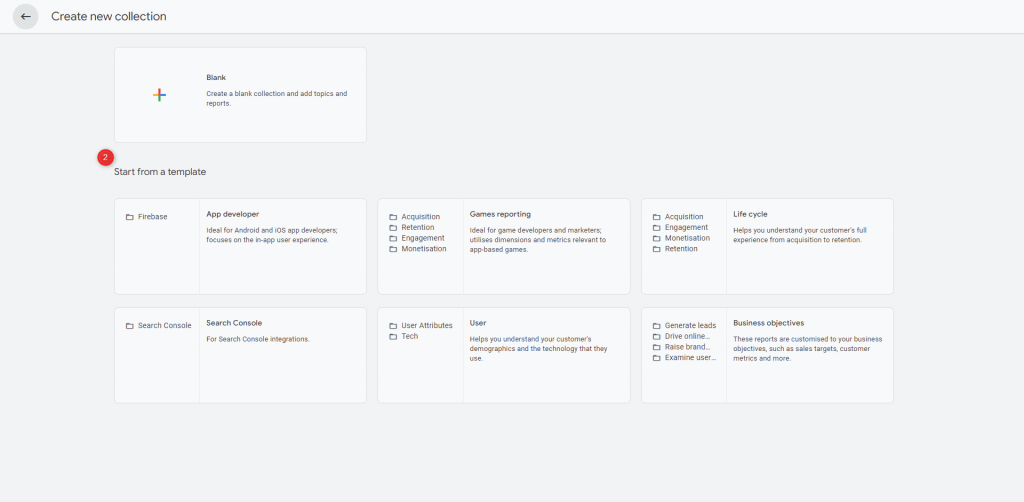
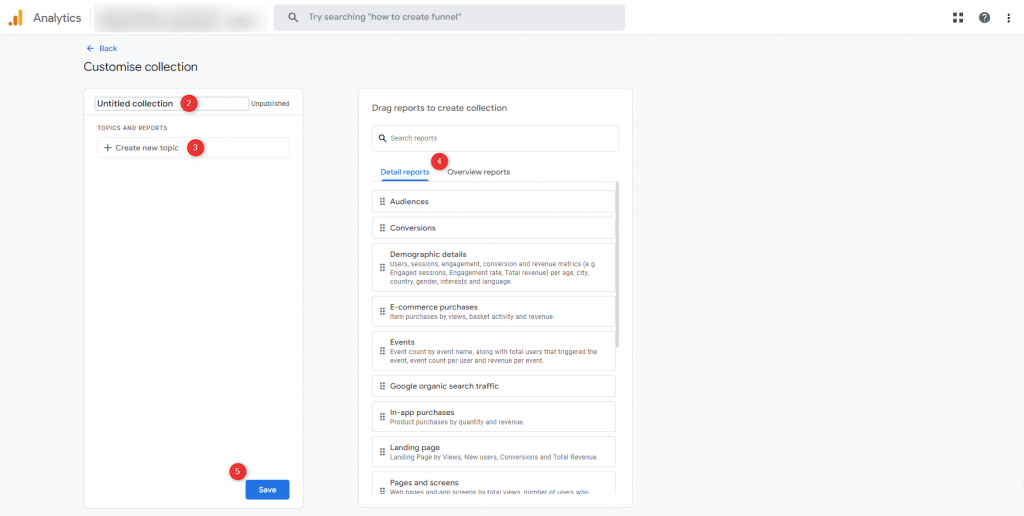
To publish a report collection, follow these steps:
Navigation
Go to “Report Library” -> Search for the collection tab you created -> Click “More” on the collection tab -> Click “Publish.”
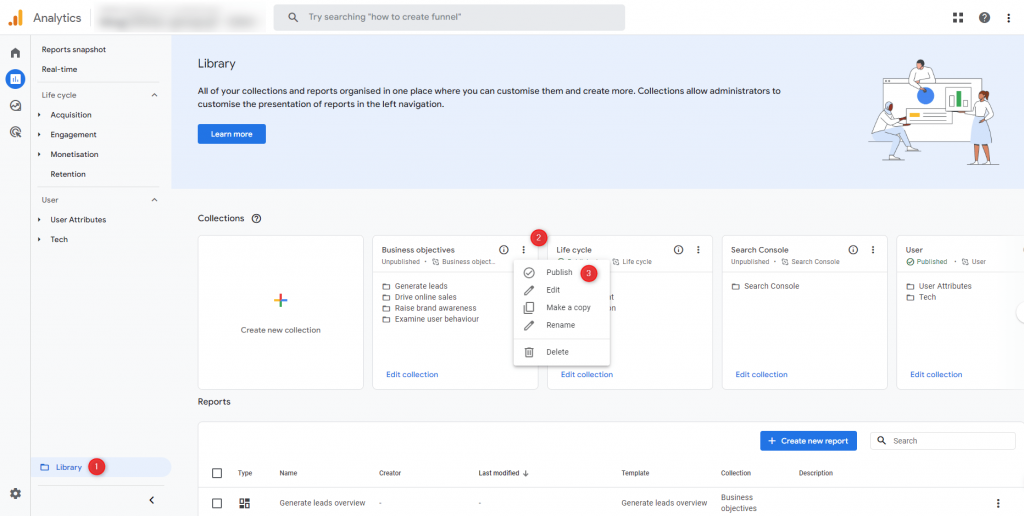
The tabs in a report collection are displayed in alphabetical order, and this order cannot be changed. However, you can customize the collection name by adding numbering to it to achieve your desired sequence.
Reports
To create a new report based on existing ones in GA4, follow the steps below:
Navigation
Go to “Report Library” -> Find the report you want to use as a template -> Click on the “More” icon to the right of the report name -> Click “Make a copy” -> Modify the report as needed and click “Save”.
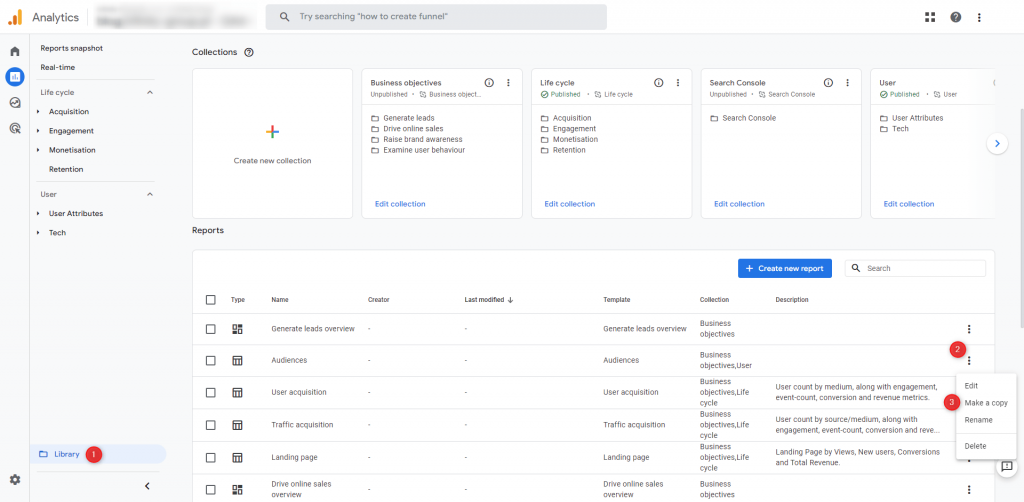
To add a newly saved report to a collection:
Navigation
Go to “Report Library” -> Find the collection tab you want to add the report to -> At the bottom of the collection, click “Edit collection” -> Select the report and drag it to the collection -> Click “Save” the collection.
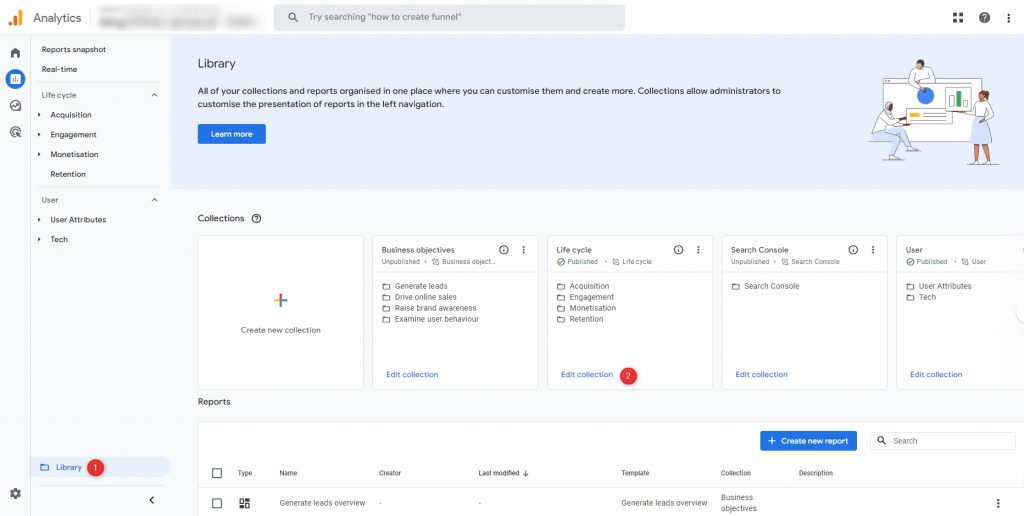
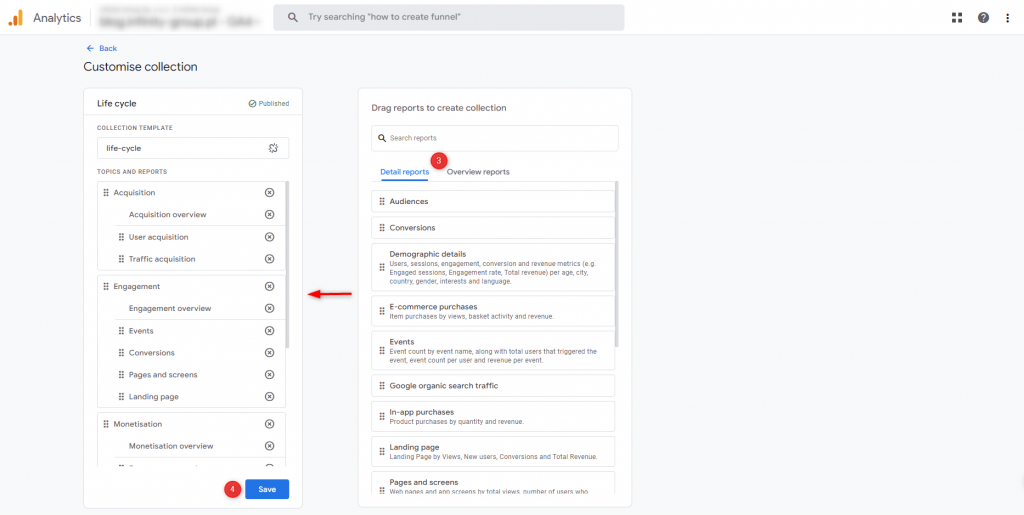
Limitations in GA4 Report Library:
- Each GA4 service can have a maximum of 7 collections, regardless of whether they are all “published” or not.
- Each collection can contain a maximum of 5 report topics.
- Each topic in the collection can contain a maximum of 10 reports, including only one overview report.
- Each GA4 service can have a maximum of 150 custom reports.
With this information, you now have a comprehensive understanding of how to tailor GA4 to your analytical requirements.
A comparison of GA3 and GA4 report views
As you’ve seen, there are numerous ways to customize GA4 to suit your specific needs. This naturally leads to the question: Can GA4 replicate the same set of reports and configurations found in Universal Analytics (UA)?
The GA4 interface provides an open canvas with a predefined report view and ample room for creating tailored solutions. However, initial encounters with the interface can evoke mixed feelings.
It’s important to note that GA4 introduces a completely new interface, and it doesn’t include the same standard reports that were familiar in UA. The few reports available in the Reports section of GA4 can’t be compared to the extensive selection of several hundred predefined reports in GA3.
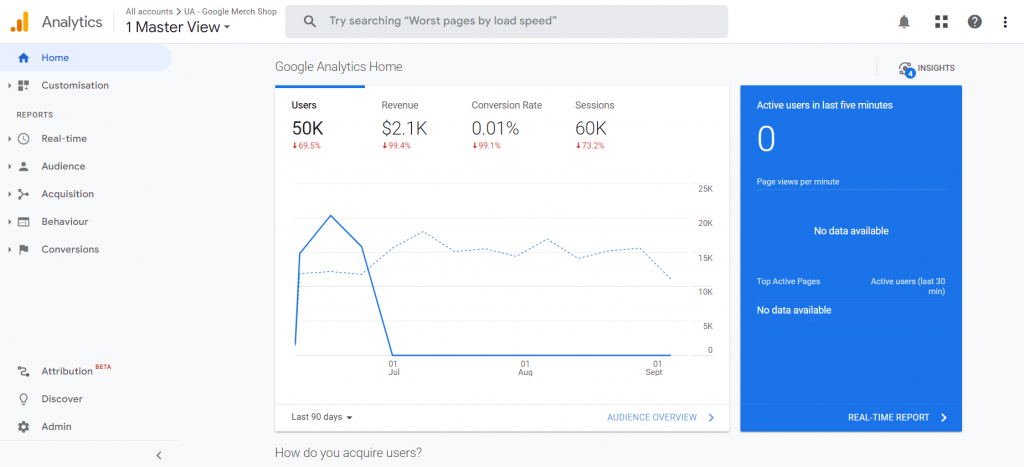
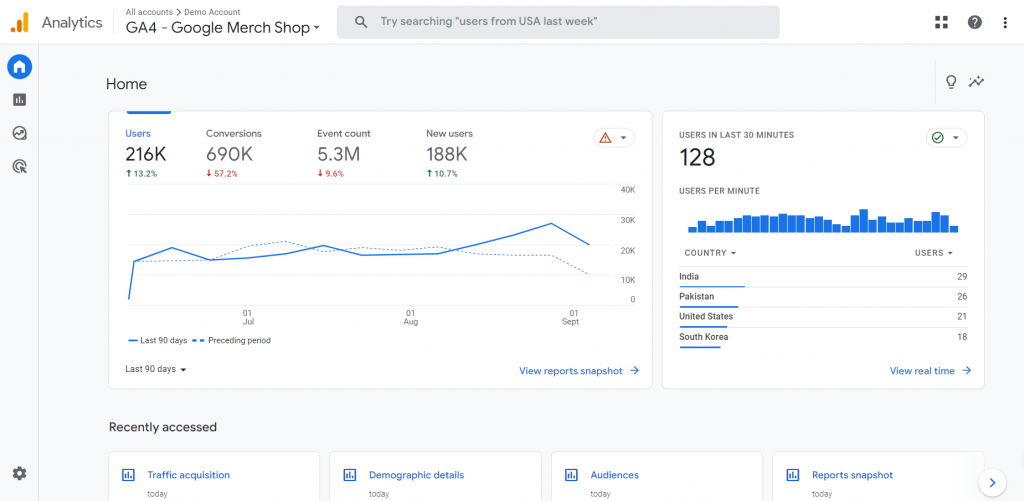
Navigation through reports has also undergone changes. In GA3, there were dedicated sections for Audience, Acquisition, Behavior, and Conversion. However, in GA4, we begin with a set of Life Cycle and User reports. If we select business goals during service configuration, we’ll also encounter a set of reports referred to as Business Goals.
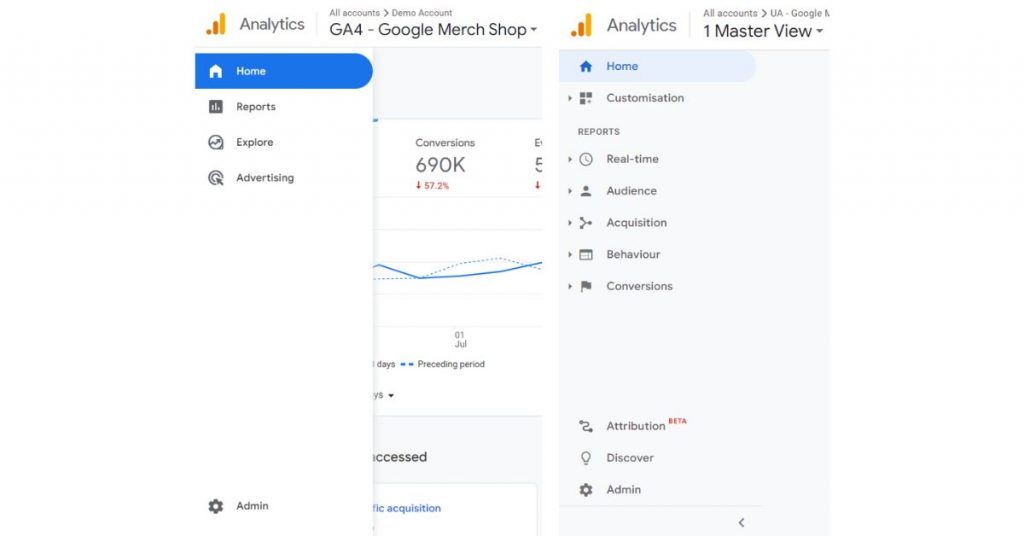
The introduction of new reports in GA4 doesn’t imply inferior analysis capabilities, just as new dimensions and metrics don’t necessarily lead to weaker campaign results. Moving from UA to GA4 isn’t inherently challenging, but it does demand a substantial investment of time and resources to reacquaint yourself with this “old tool” in a new light.
To ensure a smooth transition process, GA4 offers the possibility to recreate some reports from Universal Analytics, although as custom reports. How can you access these reports? Stay tuned for our upcoming article, set to be published on our blog (UA Reports in GA4: Audience Section). Be sure to follow our social media channels to stay informed and not miss out on the next publications about: Acquisition, Behaviour and Conversion Sections.


