If you’re reading this, chances are you’re navigating the Google Analytics 4 interface and seeking ways to recreate the reports you’re accustomed to from GA3. In the preceding article of this series, you discovered the answer to the question of whether this is even achievable. You found out that despite the introduction of numerous unfamiliar dimensions and metrics in the new version of Google Analytics, strategic configuration of the tool empowers you to shape the default set of reports and tailor it according to your specific data.
In my previous text, I replicated the reports akin to the Audience section found in Universal Analytics. Now, I’ll guide you through the steps of crafting reports in GA4 that mirror the structure of the Acquisition section. In this exploration, you’ll gain insights into locating the Standard Reports section, both in GA4 and Universal Analytics.
Additionally, I’ll equip you with valuable tips to seamlessly configure diverse reports – a step-by-step guide including:
- Data path form adapting GA4 reports to the UA version,
- Screenshots of the finalized custom report and exploration report for reference.
ATTENTION!
Consider these suggestions a wellspring of inspiration in your quest for the optimal set of reports, dimensions, and metrics.
Universal Analytics Reports in Google Analytics 4: the Acquisition section
When you compare the reports in the Acquisition section of UA with those in GA4, you’ll notice that the latter tool’s standard version is significantly more simplified.
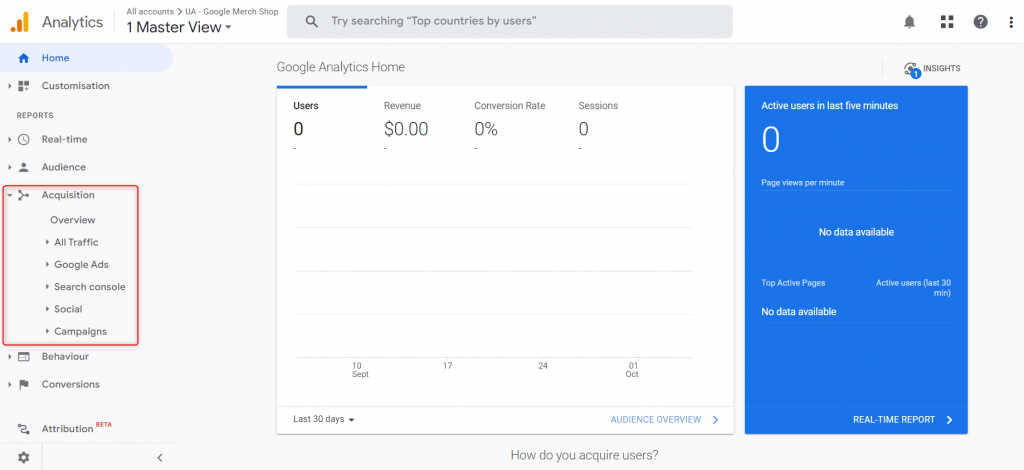
The default Acquisition section in Universal Analytics:
Reports -> Acquisition
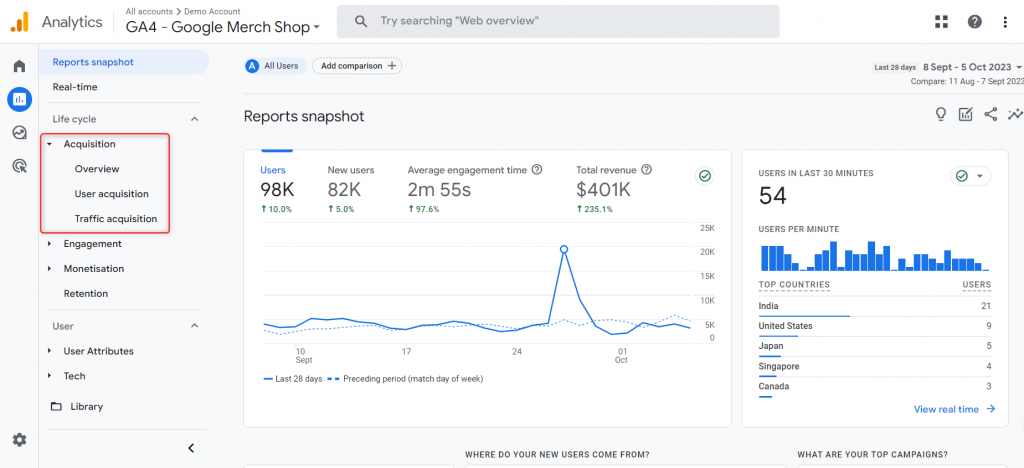
The default Acquisition section in GA4:
Reports -> Life cycle
Here are customized configurations for selected reports to assist you in navigating the analytics landscape in accordance with GA4.
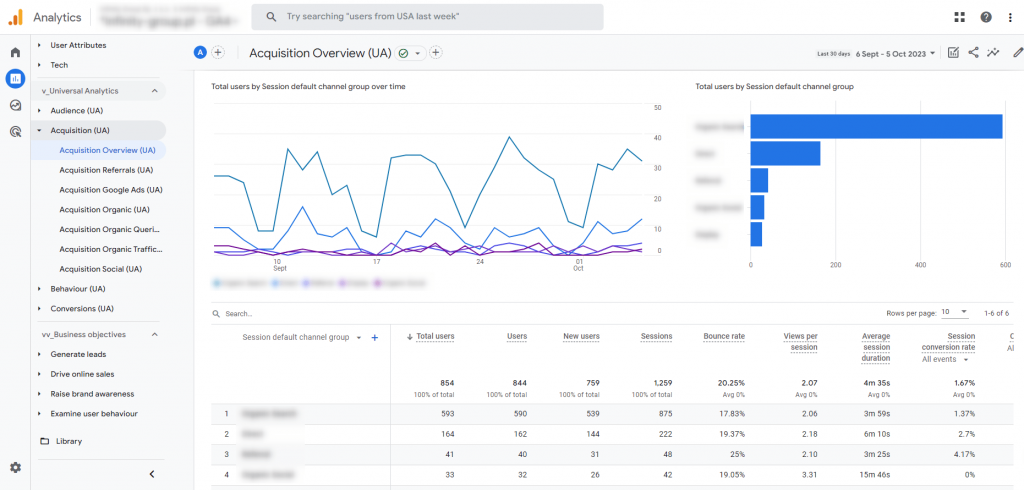
UA Acquisition -> Overview in GA4
This report is designed to analyze different dimensions in connection with acquired sessions. It covers the default channel group, source/medium, source, and campaign. The essential metrics include total users, active users, new users, bounce rate, along with average session duration and session conversion rate. Delving into these metrics enables a comprehensive evaluation of the acquisition strategy. It allows for a comparison of the performance across various channels and campaigns, presented through visual aids like line and bar charts. Ultimately, this detailed analysis facilitates the optimization of marketing activities, leading to an enhanced return on investment (ROI).
Navigation
Go to “Report Library” and click “Create New Report” above the list of reports.
Dimensions:
- Session – default channel group (Default)
- Session – source/medium
- Session – source
- Session – campaign
Metrics:
- Total users
- Users (Active users)
- New users
- Sessions
- Bounce rate
- Views per session
- Average session duration
- Session conversion rate
- Conversions
Charts:
- Line chart
- Bar chart
Reports -> Acquisition -> Acquisition Overview
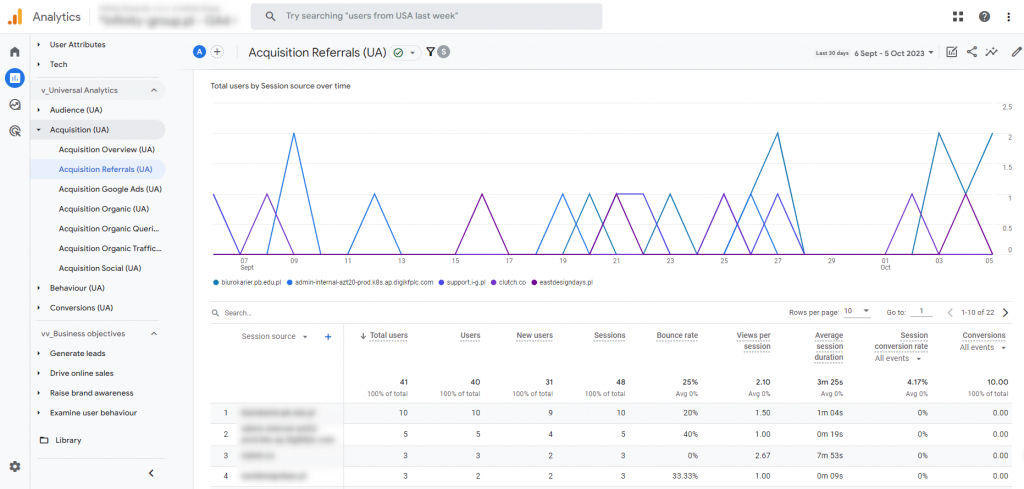
UA Acquisition -> Acquisition Referrals in GA4
This report is dedicated to leveraging the advanced features of Google Analytics 4 for a thorough analysis of referrer traffic. It delivers valuable insights into referral channels by utilizing detailed dimensions, such as session source, medium, source/medium, and campaign. Those are combined with session quality indicators and key metrics, including total users, active users, and new users. The inclusion of the “Referral” filter enhances the precision of understanding and evaluating the value of inbound traffic. Visual representation through intuitive line charts allows for a clear assessment of trends and performance comparisons among different traffic sources. This visual insight is crucial for making informed decisions and optimizing customer acquisition strategies.
Navigation
Go to “Report Library” and find the “Acquisition Overview” report. Click on the “More” icon to the right of the report name, and then click “Create a copy”.
Dimensions:
- Session – source (Default)
- Session – medium
- Session – source/medium
- Session – campaign
Metrics:
- Total users
- Users (Active users)
- New users
- Sessions
- Bounce rate
- Views per session
- Average session duration
- Session conversion rate
- Conversions
Filters:
- Session – default channel group (exactly matches: Referral)
Charts:
- Line chart
Reports -> Acquisition -> Acquisition Referrals
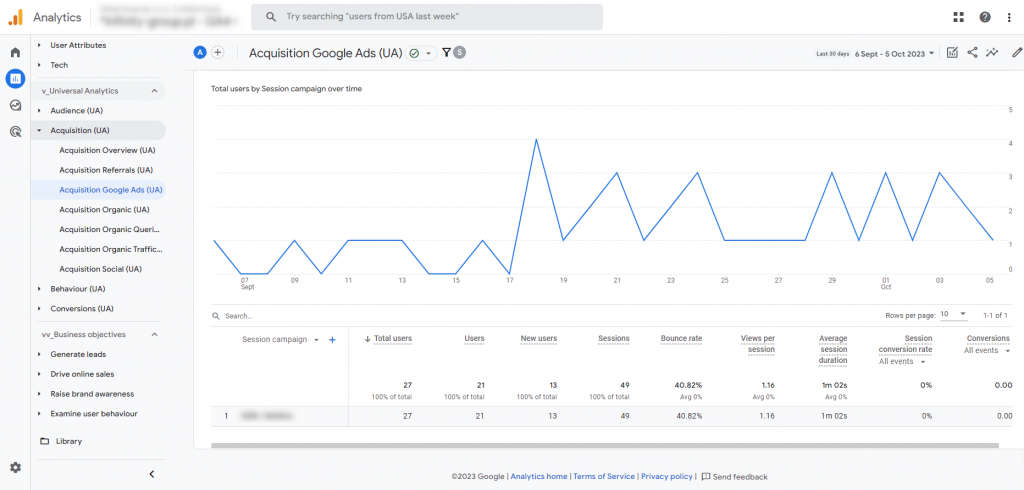
UA Acquisition -> Google Ads in GA4
This report employs specific dimensions, namely campaign, source, medium, and source/medium, complemented by comprehensive metrics. Its primary goal is to furnish marketers with detailed insights into the efficacy of their Google ad investments. Key performance metrics, including total users, new users, bounce and conversion rates, are vividly presented using intuitive line charts. To refine the analysis, strategic filters are applied, concentrating on paid ad categories like Display, Paid, and Search. This allows for a more profound understanding and evaluation of the effectiveness of diverse advertising strategies. The outcome of this analysis is invaluable for companies aiming to optimize their advertising campaigns, maximize return on investment (ROI), and fortify their online presence.
Navigation
Go to the “Report Library” and locate the “Acquisition Overview” report. Click on the “More” icon situated to the right of the report name, then select “Create a copy”.
Dimensions:
- Session – Campaign (Default)
- Session – source
- Session – medium
- Session – source/medium
Metrics:
- Total users
- Users (Active users)
- New users
- Sessions
- Bounce rate
- Views per session
- Average session duration
- Session conversion rate
- Conversions
Filters:
- Session – default channel group (matches regex: Display|Paid|Search)
Charts:
- Line chart
Reports -> Acquisition -> Acquisition Google Ads
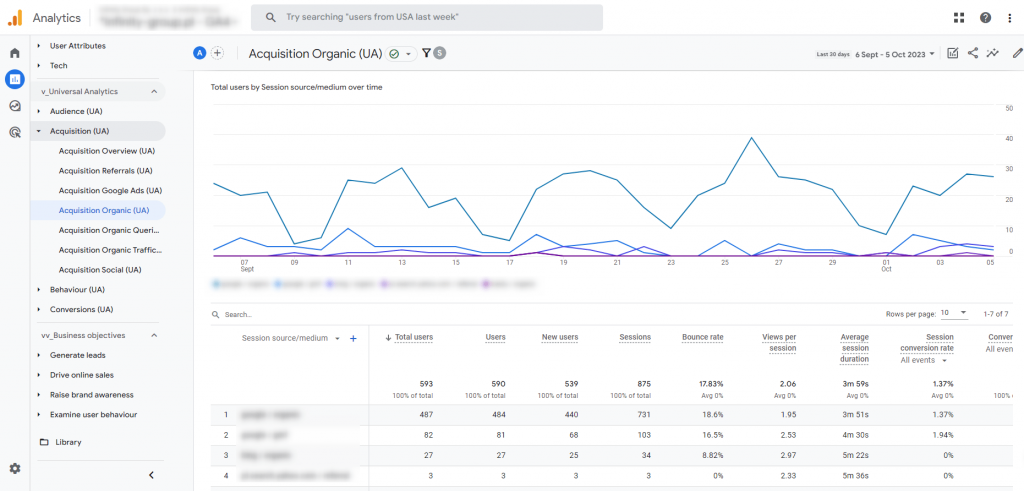
UA Acquisition -> Acquisition Organic in GA4
This report conducts a comprehensive analysis of data derived from Google’s organic results, enabling companies to monitor and assess the quality of organic traffic. It utilizes dimensions such as source/medium, origin, medium, and campaign, along with metrics like total users, new users, sessions, bounce rate, and views per session. The precision of the analysis is enhanced by a specific filter that focuses exclusively on “Organic Search,” allowing for a precise separation of data. This filter provides valuable insights into how natural search results influence user behavior and conversion efficiency. The presentation of data through line charts facilitates a quick and easy interpretation of trends. This feature is especially crucial for content marketing and SEO strategists seeking to optimize content and keywords, thereby increasing visibility, engagement, and ultimately revenue from organic channels.
Navigation
Go to the “Report Library,” locate the “Acquisition Overview” report, and click on the “More” icon positioned to the right of the report name. From the dropdown menu, select “Create a copy” to generate a duplicate of the report.
Dimensions:
- Session – source/medium (Default)
- Session – source
- Session – medium
- Session – campaign
Metrics:
- Total users
- Users (Active users)
- New users
- Sessions
- Bounce rate
- Views per session
- Average session duration
- Session conversion rate
- Conversions
Filters:
- Session – default channel group (exactly matches: Organic Search)
Charts:
- Line charts
Reports -> Acquisition -> Acquisition Organic
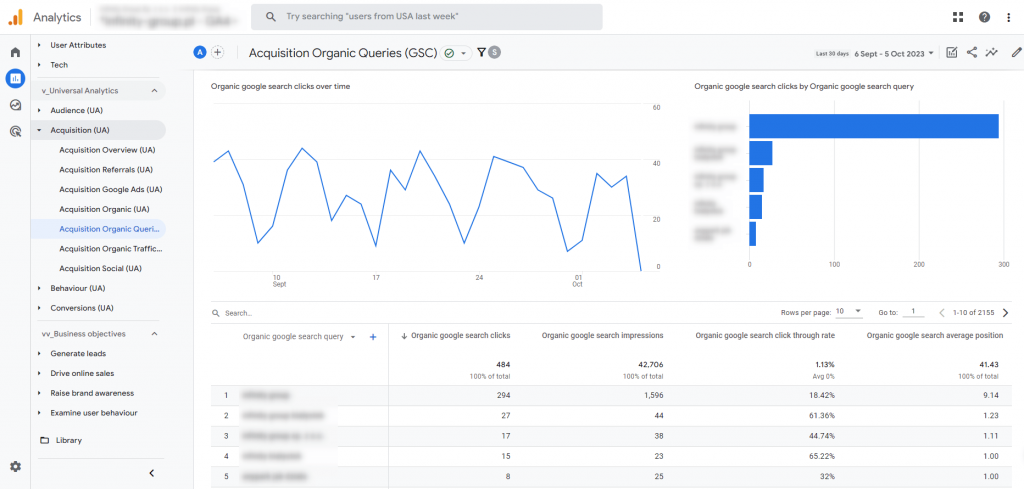
UA Acquisition -> Acquisition Organic Queries in GA4
This report serves as an invaluable tool for comprehending and optimizing the performance of organic Google search traffic. The dataset is centered on organic queries, taking into consideration criteria such as country and device category. It enables businesses to scrutinize how their content performs across various locations and platforms. Key metrics, including organic clicks, views, click-through rate, and average position in the results, provide in-depth insights into the effectiveness and visibility of content in organic search results. Additionally, a filter that allows data from a specific GA4 stream ensures precise measurement and tailoring of SEO strategies to a particular site or market segment. The inclusion of line and bar charts aids in trend analysis and performance comparisons over time, crucial for making informed decisions and enhancing organic reach on Google.
Navigation
Go to the “Report Library,” and above the list of existing reports, click on “Create New Report.”
Dimensions:
- Organic Google Search query (Default)
- Country
- Device category
Metrics:
- Organic Google Search clicks
- Organic Google Search impressions
- Organic Google Search click-through-rate
- Organic Google Search average position
Filters:
- Web data stream ID (exactly matches: Your GA4 data stream name)
Charts:
- Line chart
- Bar chart
Reports -> Acquisition -> Acquisition Organic Queries
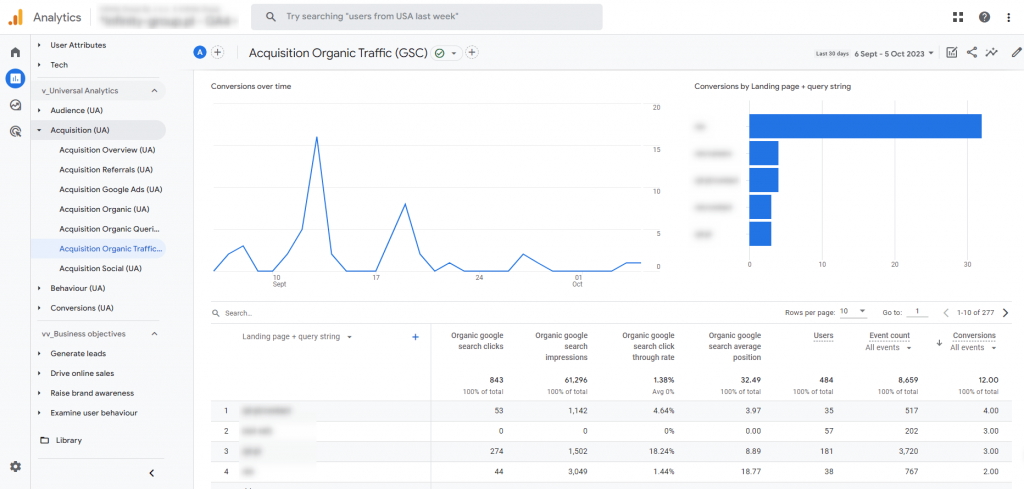
UA Acquisition -> Acquisition Organic Traffic in GA4
This report is tailored to capture data from Organic Google Search traffic, acting as a valuable resource for marketers aiming to enhance visibility and user engagement on their websites. By pinpointing the content that garners the most organic attention, it offers insights into how interactions with a site vary by geography or device type. The report utilizes dimensions such as landing page combined with the query string, country, and device category. Key metrics, including organic clicks, views, click-through rate, average position in search results, as well as active users, event count, and conversions, provide a comprehensive view of SEO effectiveness and user engagement. Visualizing this data through line and bar charts facilitates a quick and effective assessment of trends. This approach aids in the identification of areas requiring optimization, empowering companies to not only attract more organic visitors but also effectively channel traffic towards high-converting content.
Navigation
Go to the “Report Library,” locate the report titled “Acquisition Organic Queries,” and click on the “More” icon positioned to the right of the report name. From the dropdown menu, select “Create a copy.”
Dimensions:
- Landing page + query string (Default)
- Country
- Device Category
Metrics:
- Organic Google Search clicks
- Organic Google Search impressions
- Organic Google Search click-through-rate
- Organic Google Search average position
- Users (Active users)
- Event count
- Conversions
Charts:
- Line charts
- Bar charts
Reports -> Acquisition -> Acquisition Organic Traffic
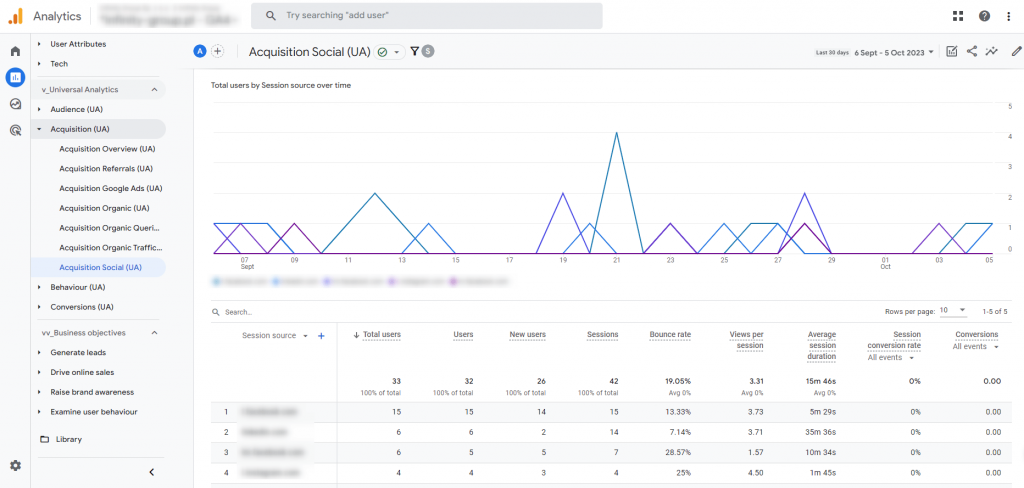
UA Acquisition -> Acquisition Social in GA4
This report offers comprehensive data derived from social networks, utilizing dimensions like session source, medium, source/medium, and campaigns. It plays a crucial role in identifying the most effective campaigns and platforms for attracting and engaging users. By analyzing metrics such as total users, active users, new users, sessions, bounce rate, views per session, average session duration, per-session conversion rate, and conversions, the report provides insights into user interactions with content and activities leading to optimal conversion results. The inclusion of a filter focusing exclusively on “Organic Social” ensures that the report specifically analyzes data from organic social sources, providing marketers with unique insights into the performance of their social content. The use of line graphs facilitates easy tracking of trends and patterns, enabling swift adjustments to strategies for greater engagement and return on investment (ROI) from social channels.
Navigation
Go to the “Report Library,” locate the “Acquisition Overview” report, and click on the “More” icon situated to the right of the report name. From the dropdown menu, select “Create a copy.”
Dimensions:
- Session – source (Default)
- Session – medium
- Session – source/medium
- Session – campaign
Metrics:
- Total users
- Users (Active users)
- New users
- Sessions
- Bounce rate
- Views per session
- Average session duration
- Session conversion rate
- Conversions
Filters:
- Session – default channel group (exactly matches: Organic Social)
Charts:
- Line charts
Raporty -> Acquisition -> Acquisition Social
With this report, we wrap up our discussion on recreating the standard UA reports from the Acquisition section in Google Analytics 4. Stay tuned to our social media channels, and don’t miss out on the final article in this series. In the upcoming blog post, we’ll delve into the Behaviour and Conversions sections, providing valuable insights for optimizing your analytics strategy.


