It has been some time since the implementation of GA4. Still, quite a large group of web analytics ‘enthusiasts’ simply cannot get used to the interface of this new tool. You probably are one of them –otherwise you would not be here. Maybe you even did some research and read our previous articles on this topic. If so, you know that adapting GA4 reports and bringing their content closer to those known from GA3 is by all means possible.
So far in this series, I have discussed how to recreate reports according to the layout of the first two sections of Universal Analytics, that is Audience and Acquisition. I have referred not only to predefined reports, but also to Exploration reports, which is a space associated with GA360, available to everyone within GA4.
In this final part of the series, I intend to offer insights into the topic of two last sections of reporting, namely Behaviour and Conversions. Similarly to the previous articles, you will learn the location of standard reports, both in UA and GA4. You will also find out how to adjust the report in GA4 to the UA version step by step.
Remember that the reports constructed for the purposes of this text represent only our vision. This is an original idea of mapping UA reports. So treat our suggestions as an inspiration in your own search for the optimal set of reports, dimensions and metrics.
Universal Analytics Reports in Google Analytics 4: the Behaviour section
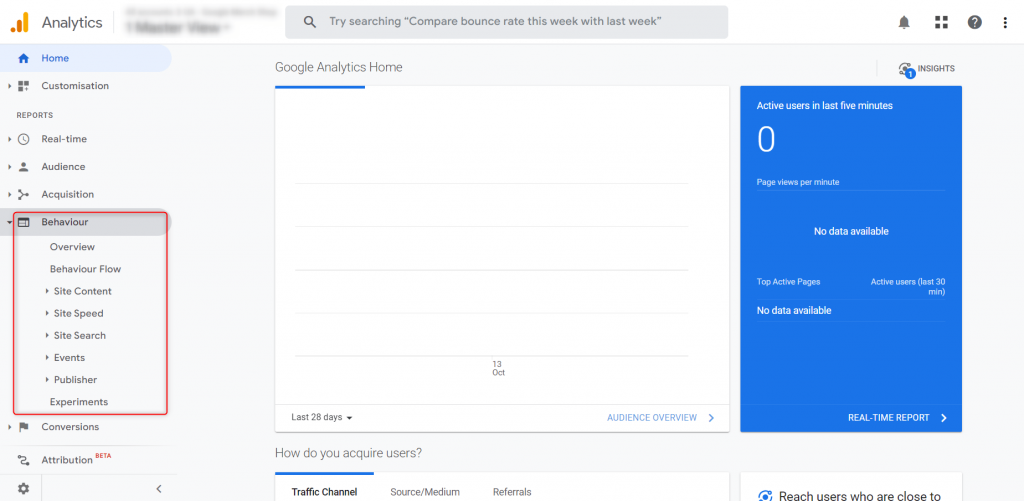
There is one conclusion from comparing the content of the reports in the Behaviour section between Universal Analytics and Google Analytics 4. In its standard version, the new tool from Google is heavily limited.
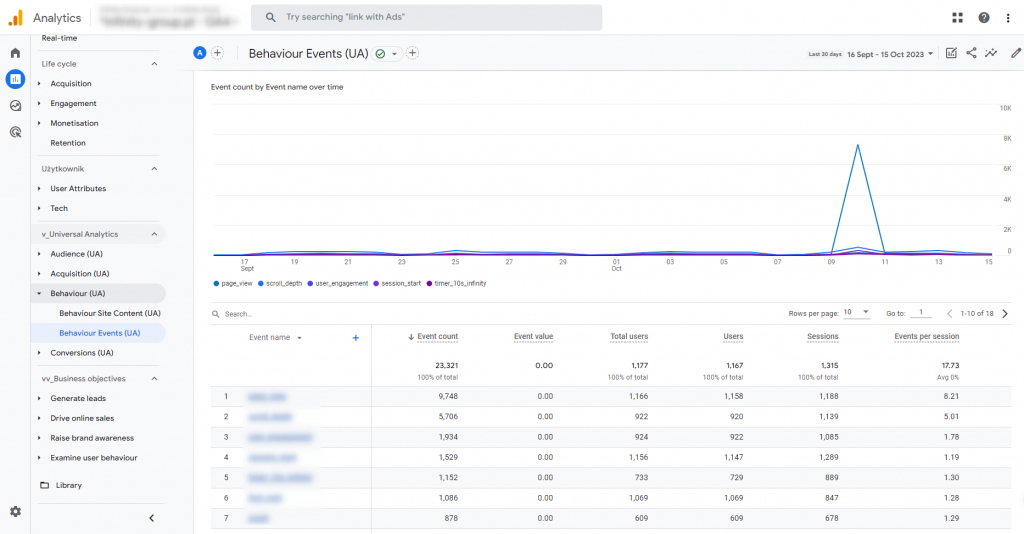
The default Behaviour section in Universal Analytics:
Reports -> Behaviour
The default Behaviour section in Google Analytics 4:
Reports -> Life cycle
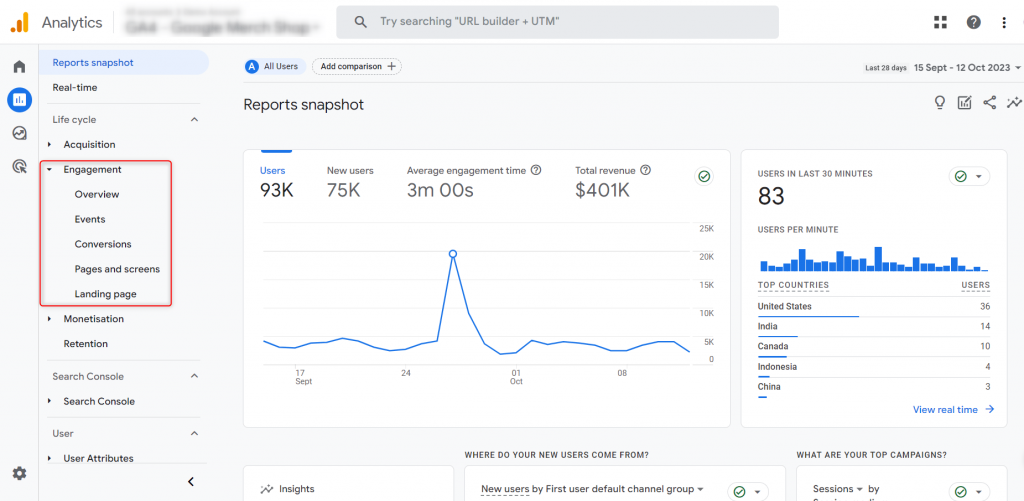
Here are customised configurations for selected reports which will help you find your footing with the interface of the new Google tool.
UA Behaviour -> Overview in GA4
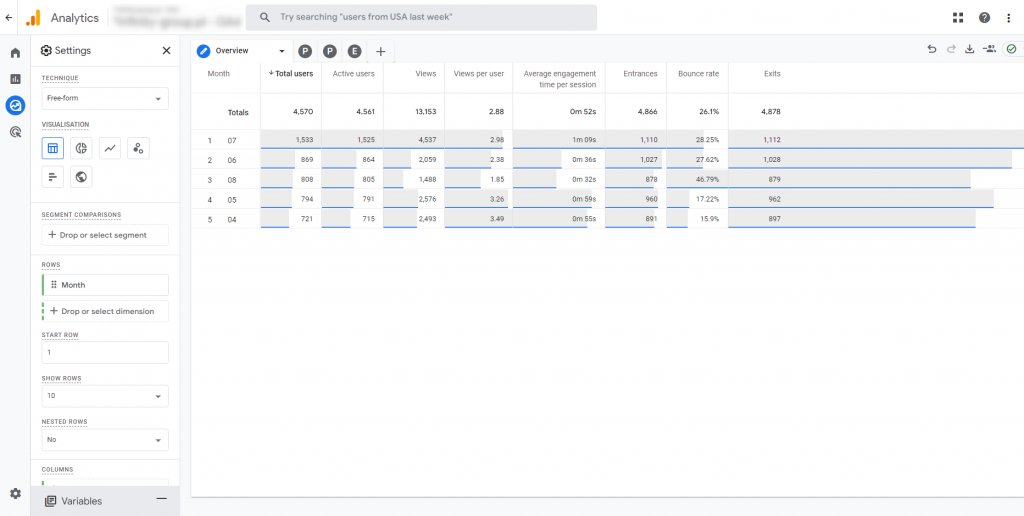
This report, collecting data from recent months, provides information on user behaviour. It offers insight into the dynamics and change trends in specific metrics: total users, active users, views, views per user, average engagement time per session, bounce rate, and entrances and exits.
Segmenting data by month helps to identify seasonal patterns and moments of increase or decrease in user activity. These observations simplify adapting marketing strategies to the needs of the examined audience. The free exploration method allows unlimited examination of the collected data. This way, you can fully understand user behaviour and identification of key areas for optimisation in marketing activities.
Navigation
Go to “Explorations”; click “Blank” template in the “Start new exploration” section.
Dimensions (Rows):
- Month
Metrics (Values):
- Total users
- Active users
- Views
- Views per user
- Average engagement time per session
- Entrances
- Bounce rate
- Exits
Method:
- Free exploration
Exploration -> Behaviour Overview
UA Behaviour -> Overview: pages in GA4
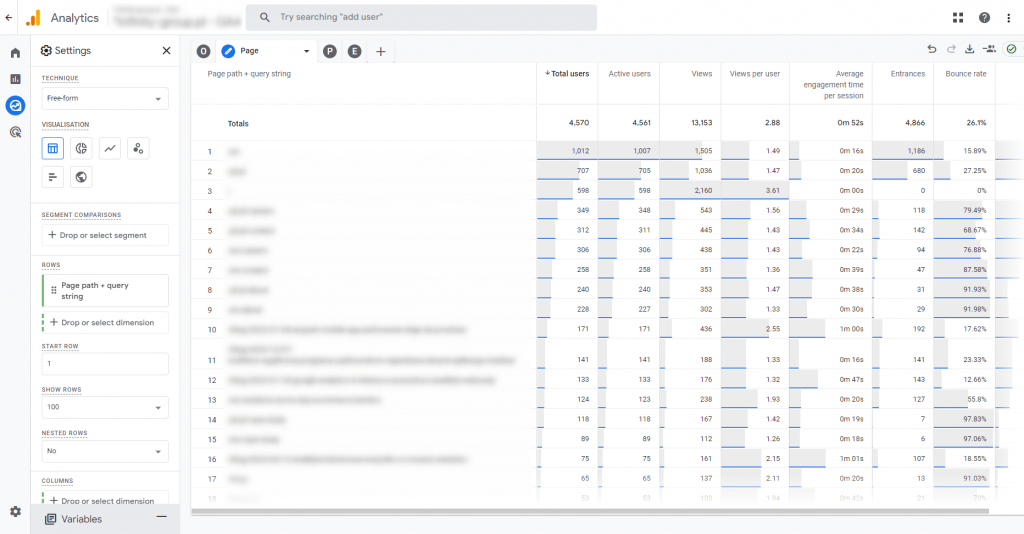
This report focuses on distinct page paths and query strings. It provides a deep understanding of which content attracts the most attention, how often specific sites lead to rejections, and how long users stay there. Identifying the most and least engaging pages allows you to optimise content and site architecture to increase user engagement and conversions. Using the free exploration method, we can identify the key areas that need attention, including those with the greatest benefit.
Navigation
Go to “Explorations”; click “Blank” template in the “Start new exploration” section.
Dimensions (Rows):
- Page path + query string
Metrics (Values):
- Total users
- Active users
- Views
- Views per user
- Average engagement time per session
- Entrances
- Bounce rate
- Exits
Method:
- Free exploration
Exploration -> Behaviour Overview: Pages
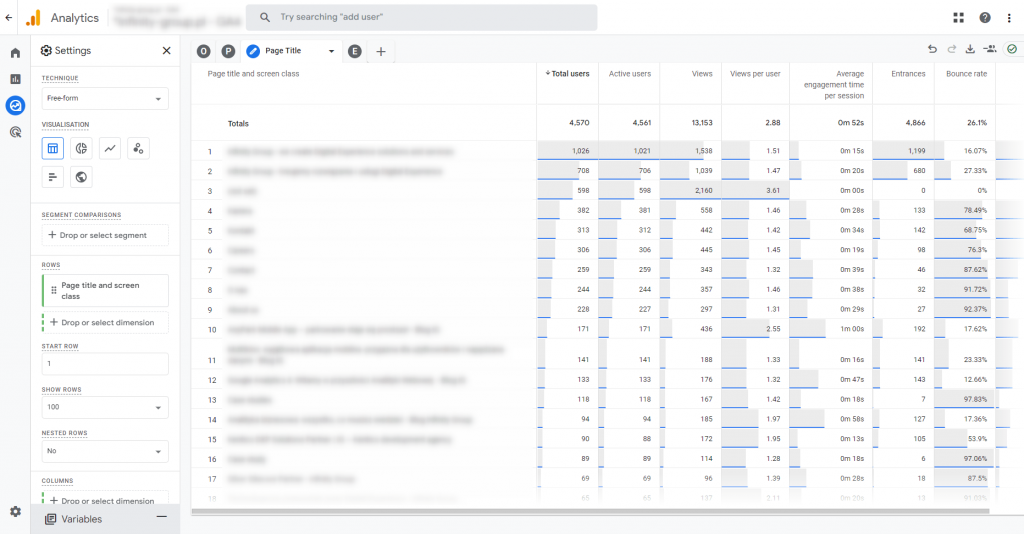
UA Behaviour -> Overview: page titles in GA4
This report allows you to explore how different page titles affect engagement, view frequency and time spent on a given page. It serves to identify the titles with the highest engagement rates, which are those that attract the most active users. This way it suggests which content areas are worth optimising first. On the other hand, the extraction of pages with a high rejection rate indicates where to improve to increase user satisfaction and keep them on the site longer.
The free exploration method allows deep understanding of these trends and marketing strategy adaptation in response to the obtained analysis results.
Navigation
Go to “Explorations”; click “Blank” template in the “Start new exploration” section.
Dimensions (Rows):
- Page title and screen class
Metrics (Values):
- Total users
- Active users
- Views
- Views per user
- Average engagement time per session
- Entrances
- Bounce rate
- Exits
Method:
- Free exploration
Exploration -> Behaviour Overview: Page Titles
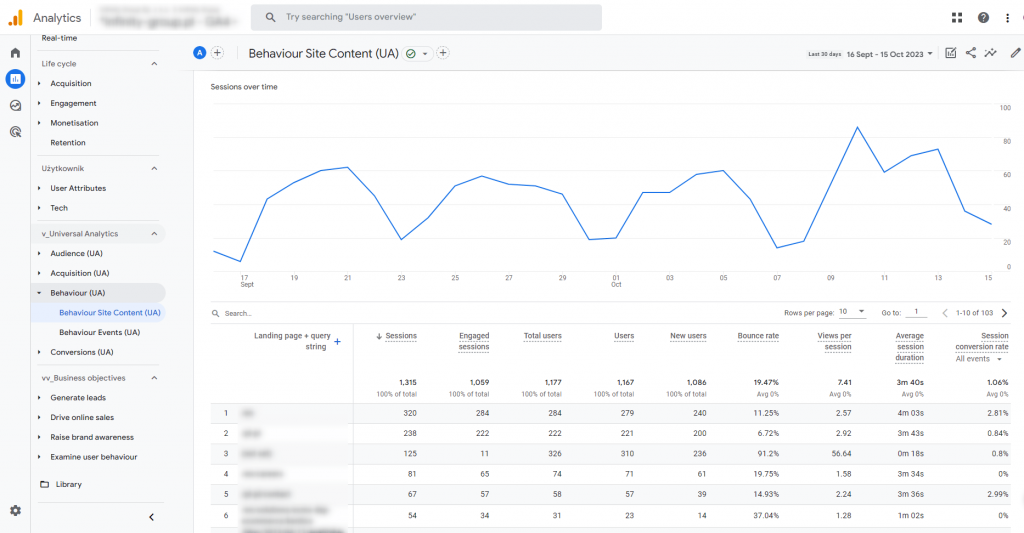
UA Behaviour -> Site Content: Landing Pages in w GA4
This report focuses on how individual landing pages with specific query strings affect user engagement, conversions and other key metrics. It helps identify which landing pages attract the most active users, generate the longest session duration and have the highest conversion rate. Meanwhile, this identifies both effective areas and those in need of optimisation. Ultimately, this kind of analysis enables effective marketing strategy adaptation, as it promotes focusing efforts where the greatest business benefits are observed.
Navigation
Go to the “Report Library,” and above the list of existing reports, click on “Create New Report.”
Dimensions:
- Landing page + query string (Default)
Metrics:
- Sessions
- Engaged sessions
- Total users
- Users (active users)
- New users
- Bounce rate
- Views per session
- Average session duration
- Session conversion rate
- Conversions
Charts:
- Line charts
Reports -> Behaviour -> Site Content: Landing Page
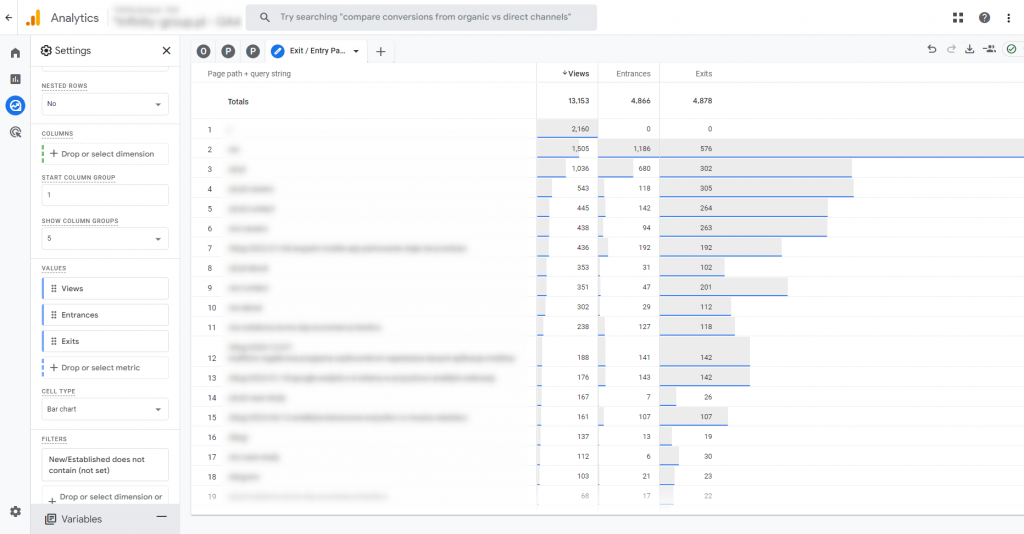
UA Behaviour -> Site Content: Entry Pages and Exits in w GA4
This report applies to page paths in combination with specific strings from parameters. It indicates which pages are the most visited, attract users, and which are the most frequent exit pages. It identifies key traffic-generating pages and potential escape points, which supports optimisation of user paths and increases engagement and conversions on the website.
Navigation
Go to “Explorations”; click “Blank” template in the “Start new exploration” section.
Dimensions (Rows):
- Page path + query string
Metrics (Value):
- Views
- Entrances
- Exits
Method:
- Free exploration
Exploration -> Behaviour Site Content: Entrances/Exits
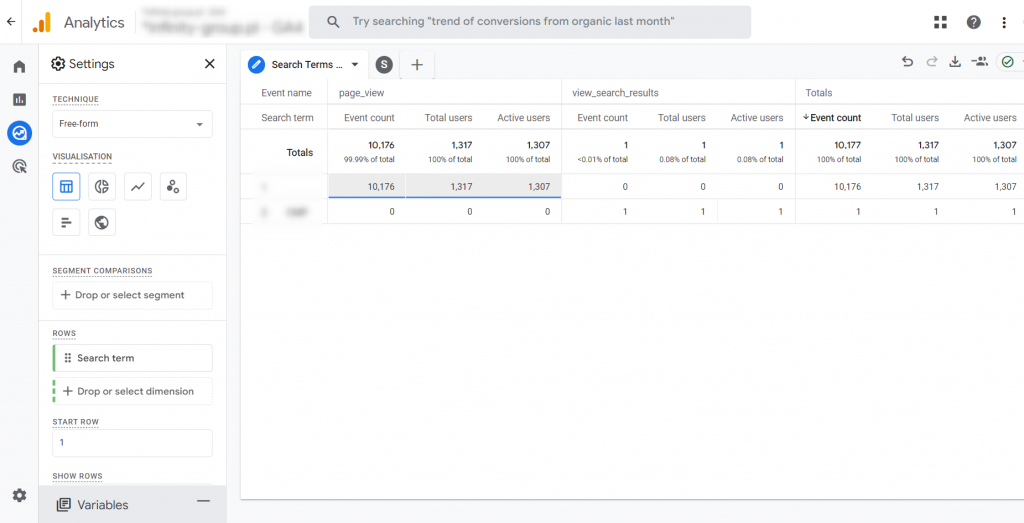
UA Behaviour -> Site Search: Search terms in GA4
This report shows the most searched keywords in relation to events, such as page views or search results. It reports what content is of most interest to users visiting your site. This will help you better tailor your site’s content to your target audience, plan more effective campaigns and significantly improve the overall user experience. Ultimately, all of this will translate into increased engagement and conversions.
Navigation
Go to “Explorations”; click “Blank” template in the “Start new exploration” section.
Dimensions (Rows):
- Search term
Dimensions (Columns):
- Event name
Metrics (Value):
- Event count
- Total users
- Active users
Filters:
- Event name: matches regex: page_view|view_search_results
Method:
- Free exploration
Exploration -> Behaviour Site Search: Search Terms
UA Behaviour -> Events in GA4
This report provides precise information about user interactions with your website. By analysing event names in combination with page paths, it is possible to determine exactly which page elements attract the most attention and generate the most value.
Metrics, such as event counts, value of events or user activity per session, enable evaluation of the effectiveness of different page elements and optimise them for better interaction and engagement. Using this report, brands can enhance their marketing efforts to meet user expectations and increase campaign effectiveness.
Navigation
Go to the “Report Library,” and above the list of existing reports, click on “Create New Report.”
Dimensions:
- Event name (default)
- page path and screen class
Metrics:
- Event count
- Event value
- Total users
- Users (Active users)
- Sessions
- Event per session
Charts:
- Line chart
Reports -> Behaviour -> Events
UA Behaviour -> Events: top events in GA4
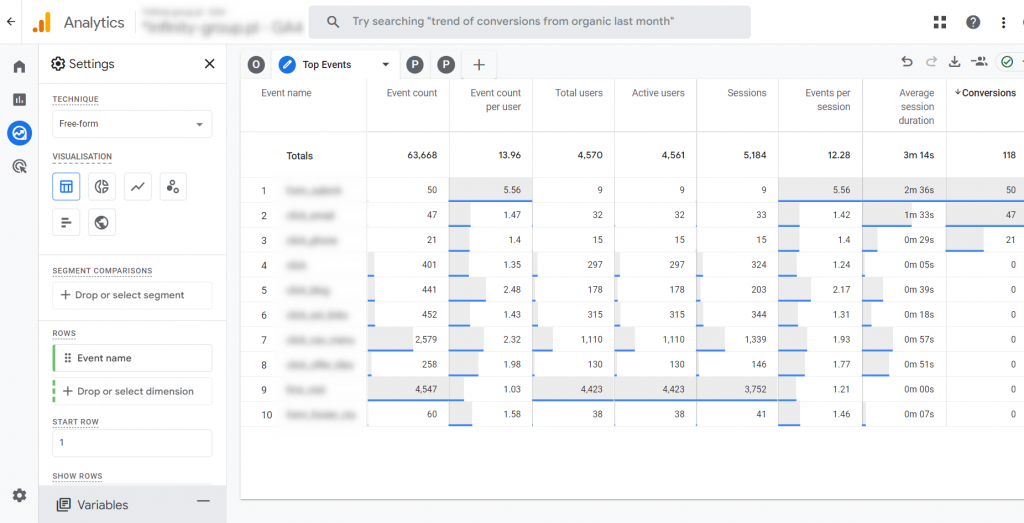
This report makes it possible to identify those events that most frequently engage users. At the same time, the report shows how these interactions affect overall activity on the site. It also takes into account average session duration or conversions. By combining the name of a distinct event with metrics such as the event counts per user or events per session, you can determine exactly which elements of the site are most effective when it comes to attracting and retaining user attention. Using this information, you may adjust your marketing strategies to effectively increase engagement and optimise conversion paths.
Navigation
Go to “Explorations”; click “Blank” template in the “Start new exploration” section.
Dimensions (Rows):
- Event name
Metrics (Values):
- Event count
- Event count per user
- Total users
- Active users
- Sessions
- Events per session
- Average session duration
- Conversions
Method:
- Free exploration
Exploration -> Behaviour -> Events: Top Events
UA Behaviour -> Events: top pages in GA4
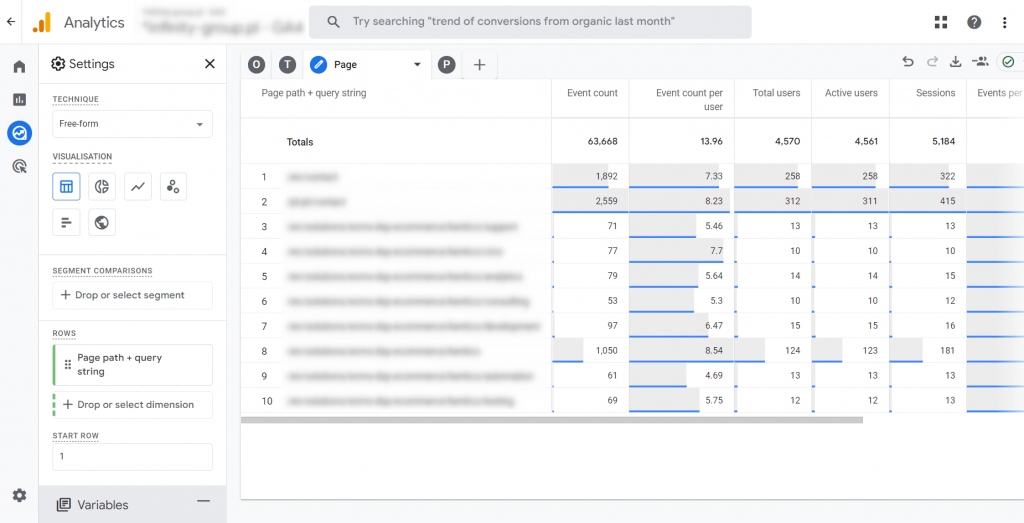
This report reports on the degree of interactivity of websites and shows how users interact with specific content. Knowing the exact paths of the addresses, along with the strings from the parameters, you can determine which pages generate the most events and how those events correlate with overall user activity (expressed in terms like average session duration or conversions). Analysing metrics such as the event counts per user or events per session in the context of individual pages, provides valuable insight into UX/UI optimisation and directions for further site development. This data will allow you to focus on enhancing pages with the highest engagement, leading to increased conversions and value delivered to users.
Navigation
Go to “Explorations”; click “Blank” template in the “Start new exploration” section.
Dimensions (Rows):
- Page path + query string
Metrics (Values):
- Event count
- Event count per user
- Total users
- Active users
- Sessions
- Event per session
- Average session duration
- Conversions
Methods:
- Free exploration
Exploration -> Behaviour -> Events: Top Pages
With this report, we finish discussing how to duplicate in Google Analytics the 4 UA standard reports from the Behaviour section. Now let us go to the final part of the reports from the Conversions section.
Universal Analytics reports in Google Analytics 4 on the Conversions section
When comparing the content of reports in the Conversions section between UA and GA4, it can be observed that this is the section of reports prepared in the finest way. There is a standard overlap between the content of the old and new versions of Google Analytics.
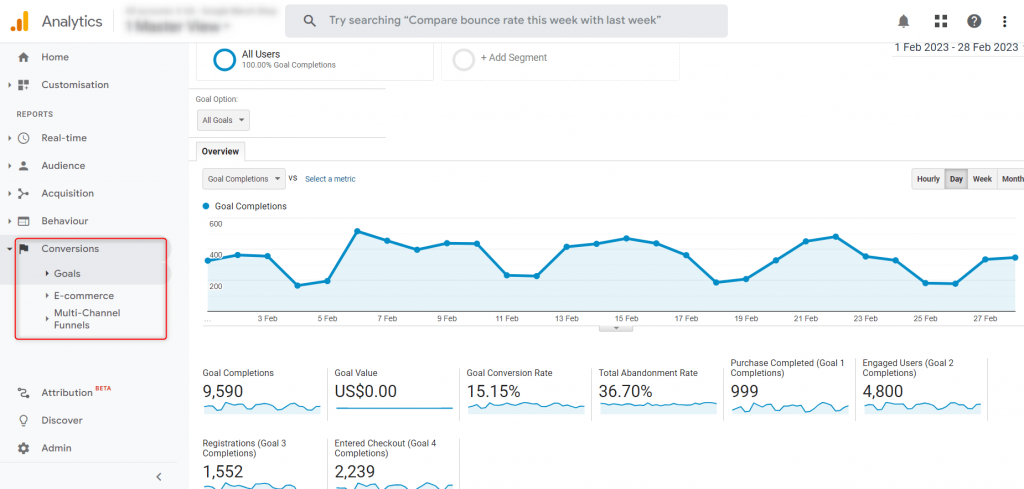
The default Conversions section in UA:
Reports -> Conversions
The default Conversions section in GA4:
Reports -> Life cycle/Monetisation
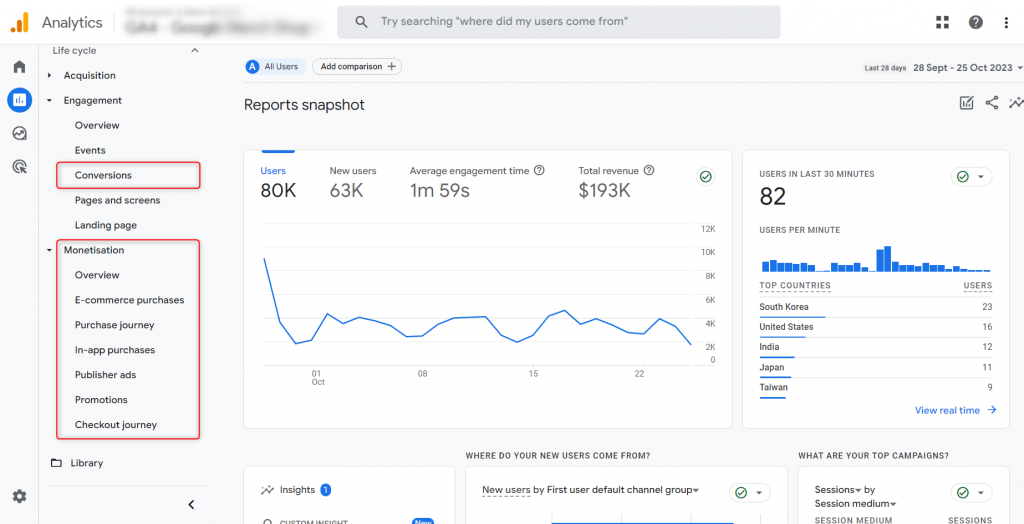
Below, there are custom configurations of selected reports from the section under discussion.
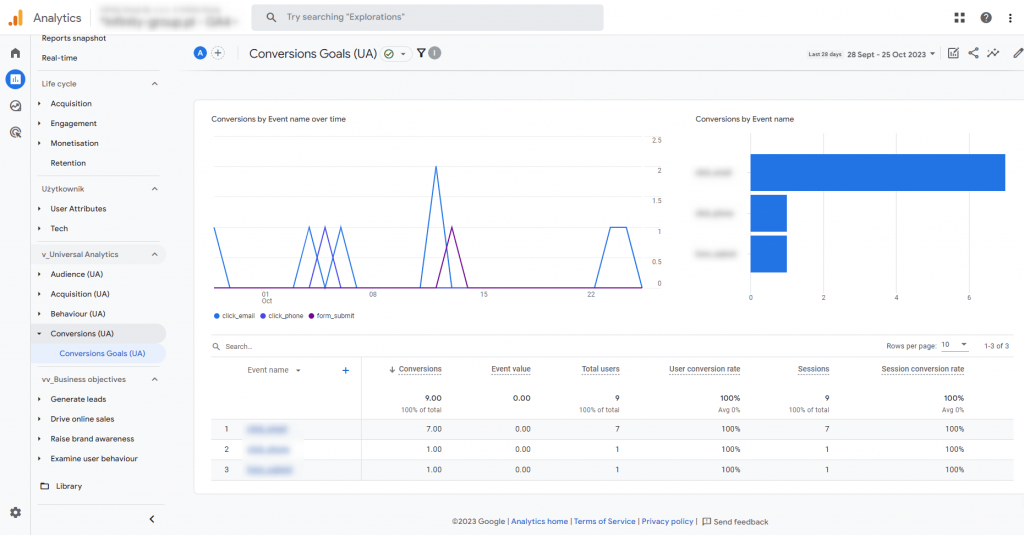
UA Conversions -> Conversion events in GA4
This report indicates which content and pages result in positive actions on the part of users. Monitoring event names, page paths and page titles, combined with metrics such as number of conversions, event value or conversion rate, allows you to identify which page elements have the biggest impact on user decisions. Additionally, line and bar charts make it easy to spot trends and areas in need of optimisation. With this information, marketers can adjust the strategies they implement to increase engagement and conversions, resulting in the best business results.
Navigation
Go to the “Report Library,” and above the list of existing reports, click on “Create New Report.”
Dimensions:
- Event name (Default)
- page path and screen class
- Page title
Metrics:
- Conversions
- Event value
- Total users
- User conversion rate
- Sessions
- Session conversion rate
Charts:
- Line chart
- Bar chart
Reports -> Conversions -> Conversion Goals
UA Conversions -> Goals: Reverse Path to Goal in GA4
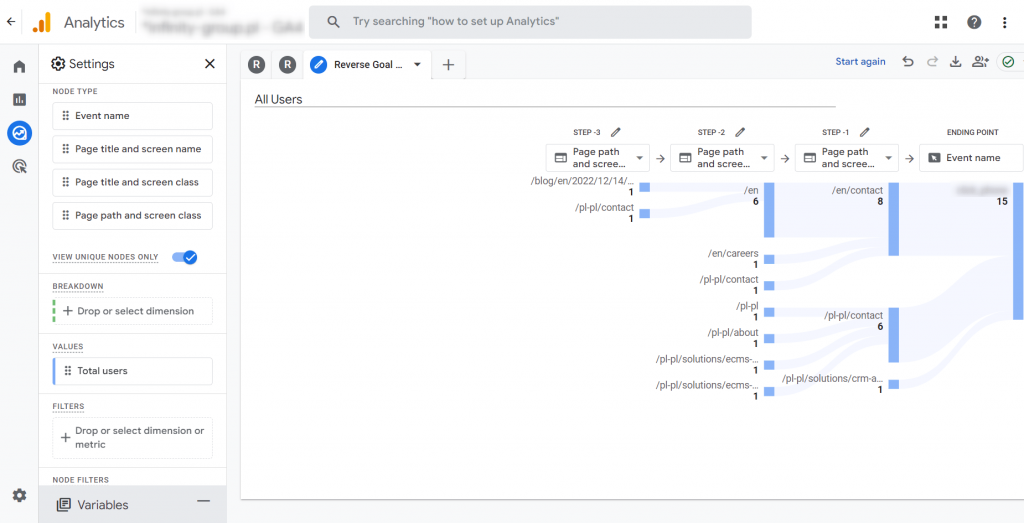
This report provides information on how users navigate a website before reaching a key conversion event. Analysing node types, such as event names, page titles, and screen classes, enables tracking and understanding the unique paths users take before they convert. Then, it becomes possible to identify the most valuable content and areas of the site (meaning those that convert best), as well as potential “blockers” in the user’s path to conversion. The path sequence mining method makes it possible to optimise user paths, increasing the probability of conversion and so improving the overall effectiveness of marketing efforts.
Navigation
Go to “Explorations”; click “Blank” template in the “Start new exploration” section; select the following data in the configuration:
Node type:
- Event name
- Page title and screen name
- Page title and screen class
- Page path and screen class
Metrics (Values):
- Total users
- Active users
- Event count
Methods:
- Path exploration
Exploration -> Conversions Reverse Goal Path
With this report, we conclude our analysis of how to recreate the standard UA reports from the Behavior and Conversions sections in Google Analytics 4. At the same time, we finish the entire series of posts on how to configure reports in GA4. In previous articles, we have already discussed the Audience and Acquisition sections. Give them a read and learn how to fully customise Google Analytics 4 to meet your needs.
Do not worry, more web analytics content will be added to our blog soon. Keep an eye on our social media to make sure you do not miss any news about new articles!


