Are you using Google Analytics 4 but finding it hard to adjust to the new interface? If you’re among those analysts who are feeling a bit disoriented by the tool’s fresh appearance, you might be wondering whether it’s possible to recreate the familiar reports from GA3 in GA4. Well, the answer isn’t straightforward.
While some predefined reports can be adapted to align more closely with the dimensions and metrics from GA3, it’s important to note that GA4 introduces a broad spectrum of new dimensions and metrics that were absent in the previous version of the tool. Additionally, it’s worth highlighting that with the right configuration of your GA4 service or data stream, you have the power to significantly shape the default report set to better suit your needs.
This article is part of our series on customizing GA4, where we gradually guide you through the process of recreating specific reports to align with the Universal Analytics sections, such as Audience, Acquisition, Behaviour and Conversions. Today, we’ll delve into creating the Audience reports and take a look at the Exploration reports, a feature that GA360 users are already familiar with and is now available to everyone in the latest Google Analytics version.
With this tutorial, you’ll discover where to find the standard reports section in Universal Analytics and its counterpart in GA4. We’ll provide you with detailed instructions on preparing various reports, including a step-by-step guide and the data path for adapting GA4 reports to the UA version. You’ll also find screenshots of the finalized custom report and exploration report for reference. With these comprehensive instructions, you’ll be well-equipped to create your own reports, not just based on those from Universal Analytics.
ATTENTION!
The reports presented below are only intended to inspire your quest for the optimal set of reports, dimensions, and metrics when mapping from Universal Analytics.
Universal Analytics reports in Google Analytics 4: the Audience section
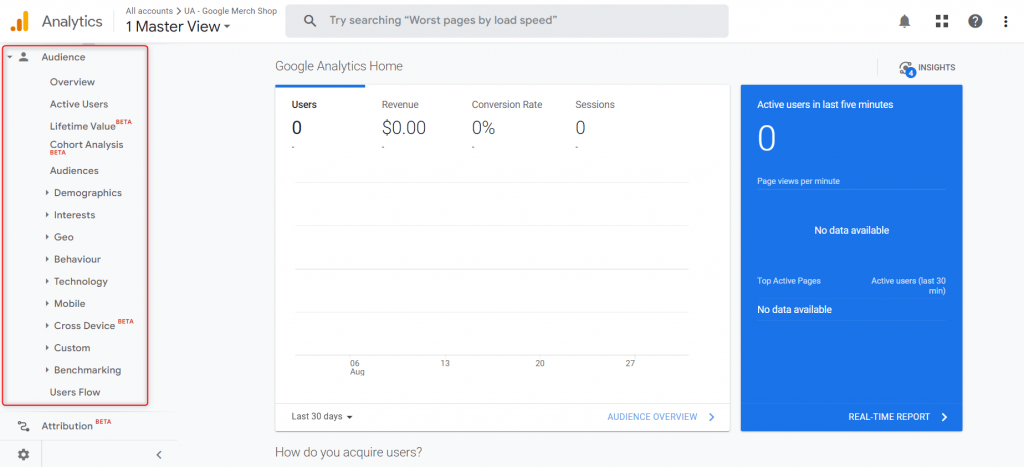
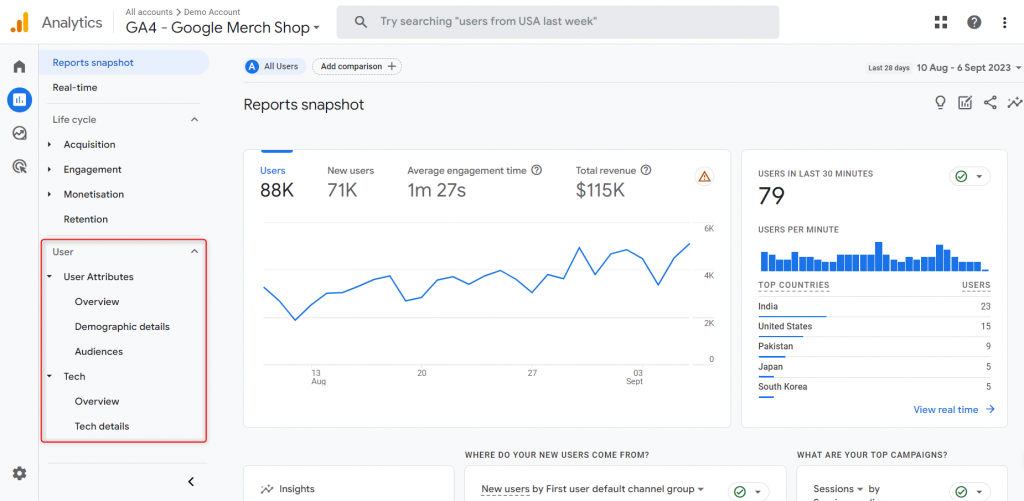
When comparing the content of reports in the Audience section between Universal Analytics and Google Analytics 4, it’s evident how minimalist GA4 has become in its standard version.
The default Audience section in Universal Analytics:
Reports -> Audience
The default User section in GA4:
Reports -> User
Here, you’ll discover custom configurations of selected reports to navigate the world of GA4 analytics with confidence.
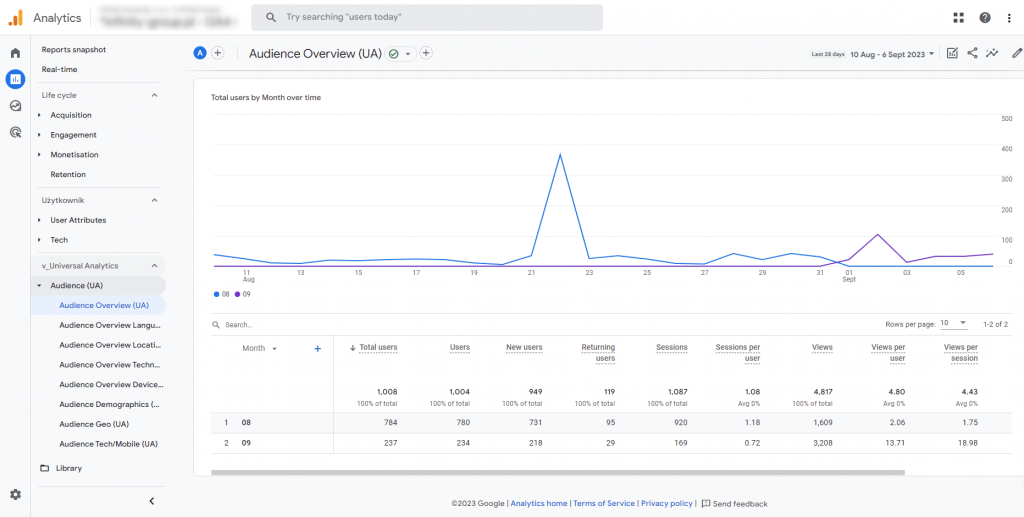
UA Audience -> Overview in GA4
This report offers key audience behaviour metrics over different timeframes – month, week, day, and hour. It provides insights into user dynamics, including total user numbers, activity levels, and the new-to-returning user ratio, as well as detailed session and view statistics, facilitating deep engagement and retention analysis. Utilizing a line chart to illustrate trends, the report emphasizes vital performance metrics like sessions per user, views per session, and average session duration. These insights empower data-driven marketing optimization and support informed business decisions. Furthermore, by focusing on bounce rates, the report identifies areas for improvement, aiding businesses in enhancing user engagement and conversions.
Navigation
Go to the ‘Report Library’ and click ‘Create New Report’ above the list of reports. In the configuration, select the following data:
Dimensions:
- Month (Default)
- Week
- Day
- Hour
Metrics:
- Total users
- Users (Active users)
- New users
- Returning users
- Sessions
- Sessions per user
- Views
- Views per user
- Views per session
- Average session duration
- Bounce rate
Charts:
- Line Chart
Reports -> Audience -> Audience Overview
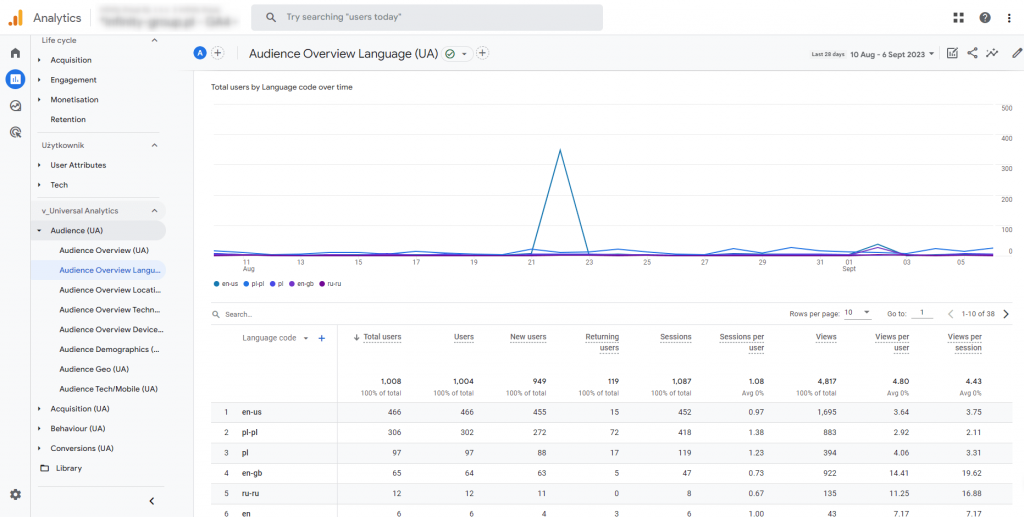
UA Audience -> Overview: Language in GA4
This report delves into the interaction of audiences from different language groups, leveraging dimensions like language code and language. It offers an in-depth analysis of key metrics, including total users, active users, new and returning users, shedding light on sessions and views within specific languages. Visualized through a line chart, the report emphasizes critical aspects for multilingual users such as sessions per user, views per session, and average session duration. It places a special focus on bounce rates, aiming to identify language barriers or user issues. This multidimensional analysis supports tailored content and marketing strategies for diverse global audiences, enabling content personalization, increased engagement, and higher conversions.
Navigation
Go to the ‘Report Library,’ locate the ‘Audience Overview’ report, and click the ‘More’ icon to the right of the report name. Then, select ‘Create a copy’ and configure the following details:
Dimensions:
- Language Code
- Language
Metrics:
- Total Users
- Users (Active users)
- New Users
- Returning User
- Sessions
- Sessions per User
- Views
- Views per user
- Views per session
- Average Session Duration
- Bounce Rate
Charts:
- Line Chart
Reports -> Audience -> Audience Overview Language
UA Audience -> Overview: Location in GA4
This report focuses on audience behaviour from a geographical perspective, leveraging dimensions like country, city, region, and subcontinent. It offers detailed insights into user interactions across different locations. By analyzing key metrics, including total users, active users, new and returning users, session and views data, the report provides strategic insights into how diverse geographical demographics engage with the online platform. Visualized through a line chart, the report illustrates trends and usage patterns in these various areas, emphasizing metrics like sessions per user, views per session, and average session duration. It also pays close attention to the bounce rate, highlighting potential content or usability issues in specific locations. This analysis is invaluable for companies seeking to optimize online marketing strategies, and personalize content and features for regional audiences, ultimately leading to increased engagement, customer loyalty, and global conversions.
Navigation
Go to the ‘Report Library,’ locate the ‘Audience Overview’ report, and click the ‘More’ icon to the right of the report name. Then, select ‘Create a copy’ and configure the following details:
Dimensions:
- Country
- City
- Region
- Subcontinent
Metrics:
- Total Users
- Users (Active users)
- New Users
- Returning Users
- Sessions
- Sessions per User
- Views
- Views per user
- Views per session
- Average Session Duration
- Bounce Rate
Charts:
- Line Chart
Reports -> Audience -> Audience Overview Location
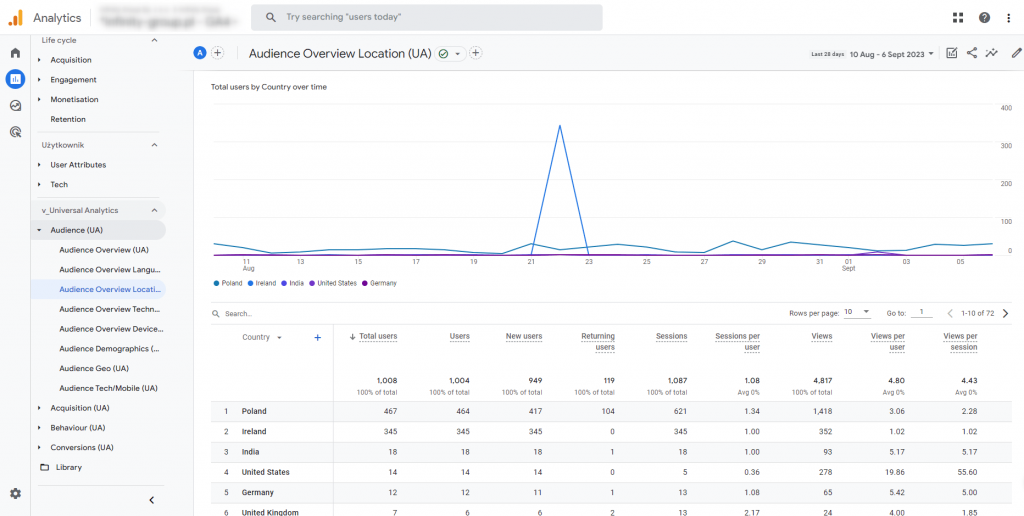
UA Audience -> Overview: Technology in GA4
The report delves into user behaviour categorized by the technology they use, considering dimensions like the browser and operating system. Through a thorough examination of metrics, encompassing total users, active users, new users, and returning users, as well as in-depth session and views data, we gain insights into how the choice of technology platform influences user interactions with online content. The inclusion of a line chart effectively visualizes metric trends over time, aiding in the identification of usage patterns specific to certain technologies.
Crucial metrics such as sessions per user, views per session, average session duration, and bounce rates provide valuable insights into potential compatibility issues and user preferences. This knowledge serves as a cornerstone for optimizing the user experience, enhancing content accessibility across various platforms, and ultimately boosting user engagement and loyalty, irrespective of their chosen technology.
Navigation
Go to “Report Library” -> Find the report “Audience Overview” -> Click on the “More” icon to the right of the report name -> Click “Create a copy” -> Select the following data in the configuration:
Dimensions:
- Browser (Default)
- Operating system
Metrics:
- Total users
- Users (Active users)
- New users
- Returning users
- Sessions
- Sessions per user
- Views
- Views per user
- Views per session
- Average session duration
- Bounce rate
Charts:
- Line Chart
Reports -> Audience -> Audience Overview Technology
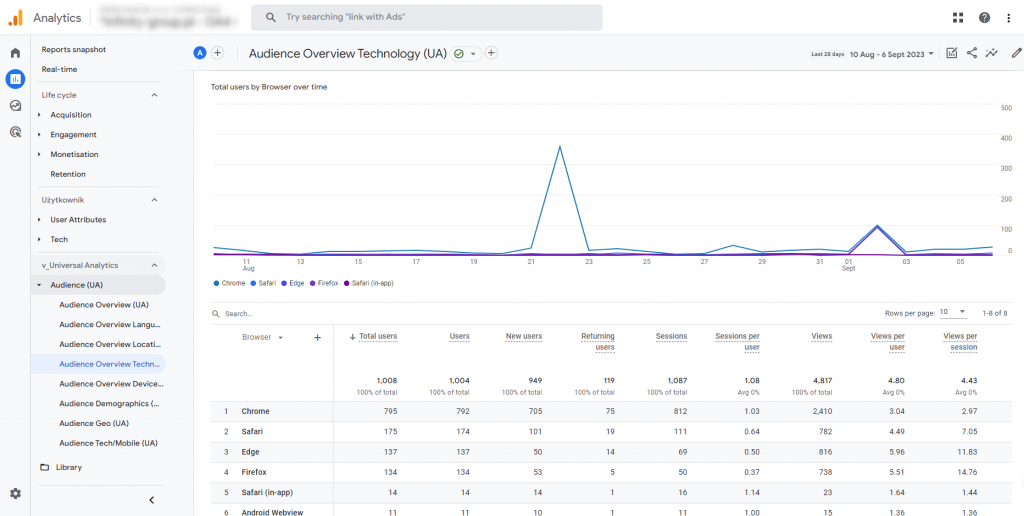
UA Audience -> Overview: Devices in GA4
The report delves into user interactions with digital content across various devices, utilizing dimensions such as device category, model, operating system (including version), and screen resolution. By scrutinizing crucial metrics, encompassing total users, active users, new users, and returning users, as well as session and view data, the report provides a comprehensive understanding of how device-specific attributes can impact user engagement. Visualized through a line chart over time, this analysis accentuates significant metrics like sessions per user, views per session, and average session duration. Furthermore, the identification of bounce rates serves as a valuable indicator for potential accessibility or compatibility issues across different devices. These insights play a pivotal role in shaping marketing strategies aimed at optimizing content and functionality for diverse devices, ultimately enhancing the overall user experience, fostering loyalty, and driving higher conversion rates in the dynamic digital landscape.
Navigation
Go to “Report Library” -> find the report “Audience Overview” -> click on the “More” icon to the right of the report name -> click “Create a copy” -> select the following data in the configuration:
Dimensions:
- Device Category (Default)
- Device Model
- Operating System and Versions
- Screen Resolution
Metrics:
- Total users
- Users (Active Users)
- New Users
- Returning Users
- Sessions
- Sessions per User
- Views
- Views per user
- Views per session
- Average Session Duration
- Bounce Rate
Charts:
- Line Chart
Reports -> Audience -> Audience Overview Devices
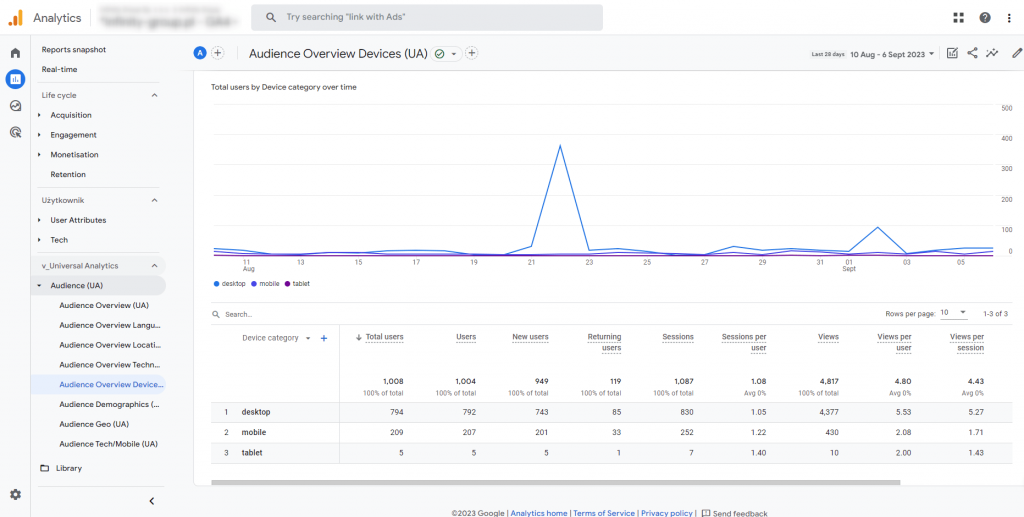
UA Audience -> User Explorer at GA4
The report leverages advanced data mining techniques to gain profound insights into individual user journeys and behaviours on the online platform. Using dimensions like effective user ID, stream name, and crucial metrics such as the event count, sessions, average session duration, bounce rate, in-session conversion rate, and conversions, this report provides a comprehensive examination of unique user interactions. The User Behaviour Explorer method empowers businesses not only to comprehend how users navigate and engage with content but also to identify significant conversion milestones and obstacles within each user’s journey. These comprehensive analyses are imperative for enhancing individual user experiences, tailoring conversion pathways, and maximizing the overall efficacy of online marketing strategies by recognizing and responding to the distinct needs and behaviours of each user.
Navigation
Go to “Exploration” -> under “Start a new exploration” click on the “User behaviour explorer” template -> select the following in the configuration:
Dimensions (Lines):
- Effective user ID
- Stream name
Metrics (Values):
- Event count
- Sessions
- Average session duration
- Bounce rate
- Session conversion rate
- Conversions
Method:
- User explorer
Exploration -> Audience User Explorer
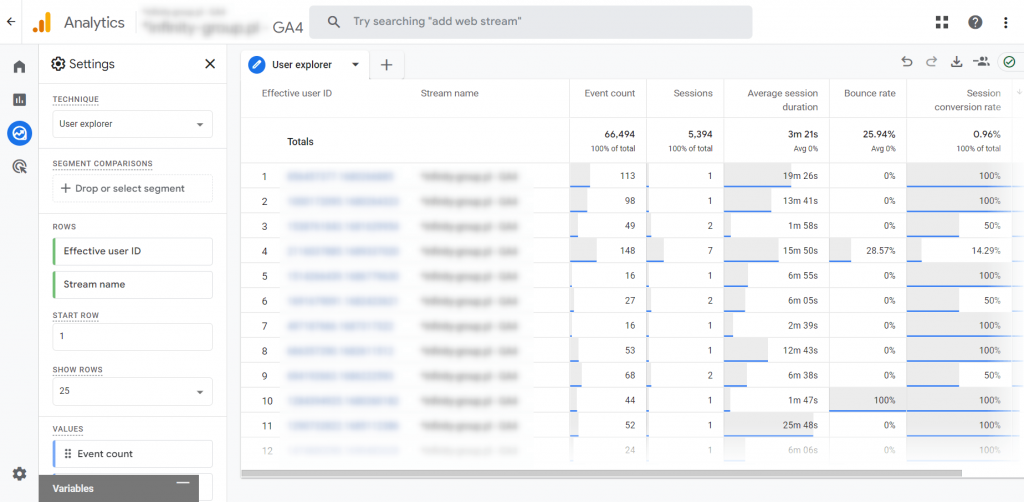
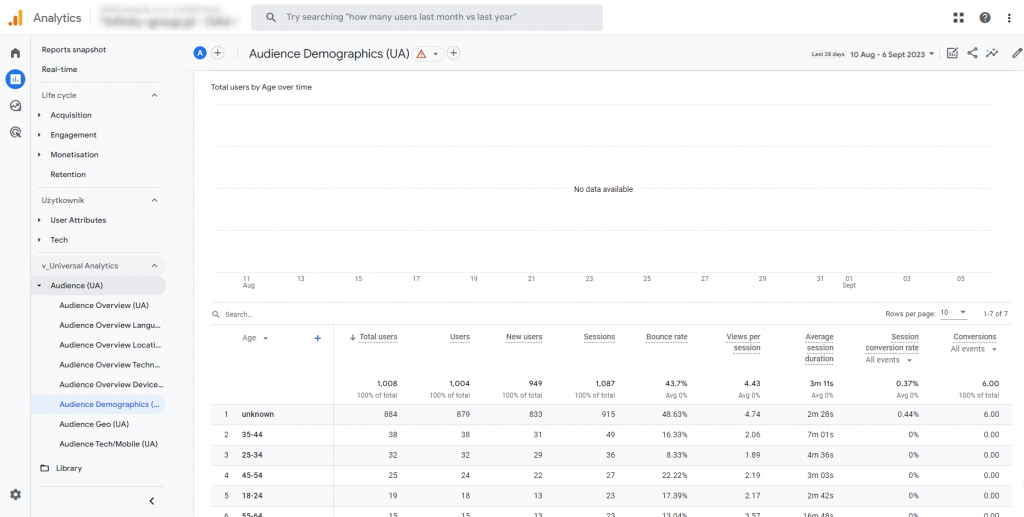
UA Audience -> Audience Demographics in GA4
The report provides a tool for online marketers to deeply understand and segment their audience. Using dimensions such as age, gender and interests, combined with metrics including total users, active and new users, sessions, bounce rate, views per session, average session duration, in-session conversion rate and conversions, businesses are able to accurately profile their audience. This report not only illustrates how different demographic segments interact with an online brand but also identifies which demographic groups have the highest engagement and conversion rates. A line chart enables analysis of trends over time, highlighting key patterns and opportunities. These insights are invaluable for marketing strategies that seek to personalise content, advertising and product offers to better resonate with specific audiences, thereby increasing marketing effectiveness and ROI.
Navigation
Go to the “Report Library” and locate the “Create new report” option positioned above the list of reports. Then, proceed to configure the report by selecting the following data:
Dimensions:
- Age (Default)
- Gender
- Interests
Metrics:
- Total users
- Users (Active users)
- New users
- Sessions
- Bounce rate
- Views per session
- Average session duration
- Session conversion rate
- Conversions
Charts:
- Line Chart
Reports -> Audience -> Audience Demographics
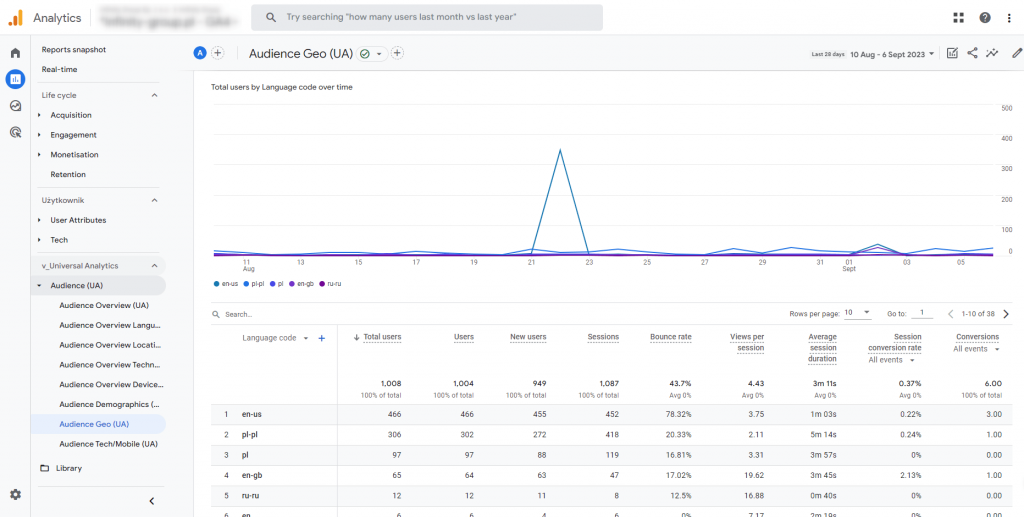
UA Audience -> Audience Geo in GA4
This report serves as a valuable tool for online marketing strategists, offering comprehensive insights into the geographical distribution and behaviour of users. By leveraging dimensions such as language code, language, city, country, region, and subcontinent, along with metrics encompassing total users, active and new users, sessions, bounce rate, views per session, average session duration, session conversion rate, and conversions, marketers gain a holistic understanding of their user base’s origin and how these interactions impact business outcomes. Presenting this data through a line chart enhances the comprehension of location-specific trends and patterns. Such information proves indispensable for the creation of localized advertising campaigns, customization of content to cater to regional audience preferences, and the optimization of market entry strategies aimed at maximizing engagement and conversions.
Navigation
Go to the “Report Library.” Above the list of reports, click “Create New Report” or locate the “Audience Demographics” report. Click on the “More” icon to the right of the report name, then select “Create a copy.” In the configuration, choose the following data:
Dimensions:
- Language code (Default)
- Language
- City
- Country
- Region
- Subcontinent
Metrics:
- Total users
- Users (Active users)
- New users
- Sessions
- Bounce rate
- Views per session
- Average session duration
- Session conversion rate
- Conversions
Charts:
- Line Chart
Reports -> Audience -> Audience Geo
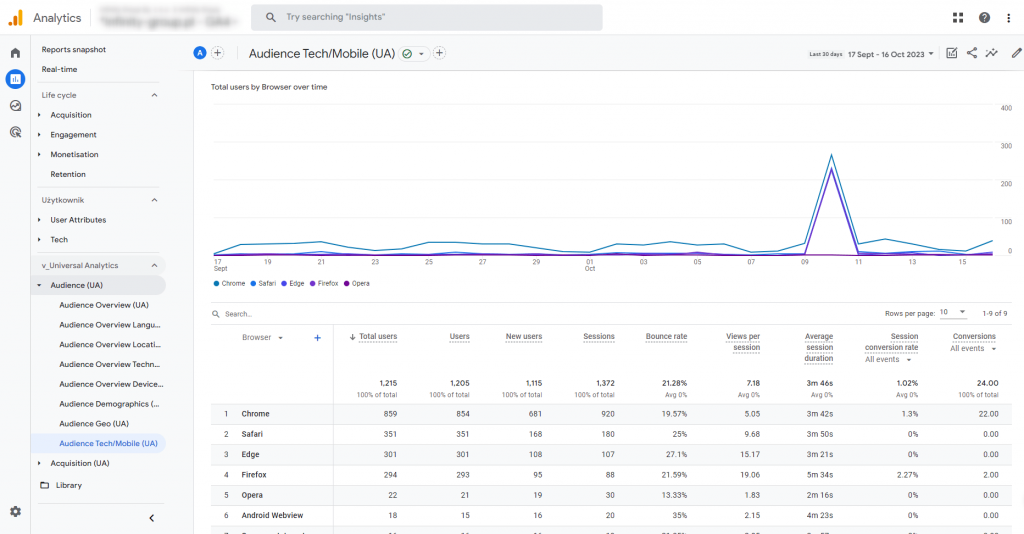
UA Audience -> Mobile traffic in GA4
This report is invaluable for online businesses seeking to gain deeper insights into the mobile user experience. By utilizing data related to browsers, operating systems, device categories, device models, operating system with versions, and screen resolutions, marketing professionals can develop a comprehensive understanding of mobile user profiles. Key metrics such as the total number of users, active and new users, sessions, bounce rates, views per session, average session duration, in-session conversion rates, and conversions provide essential information to uncover user behaviours, preferences, and areas for improvement within this rapidly expanding demographic. Visualizing this data through a line chart simplifies the tracking of trends and the evaluation of campaign effectiveness. This is crucial for shaping an effective mobile strategy that enhances engagement and drives conversions in the mobile environment.
Navigation
Go to “Report Library” and either click “Create New Report” above the list of reports or find the “Audience Demographics” report. Click on the “More” icon to the right of the report name, then select “Create a copy.” In the configuration, choose the following data:
Dimensions:
- Browser (Default)
- Operating system
- Device category
- Device model
- Operating system and version
- Screen resolution
Metrics:
- Total users
- Users (Active users)
- New users
- Sessions
- Bounce rate
- Views per session
- Average session duration
- Session conversion rate
- Conversions
Charts:
- Line Chart
Reports -> Audience -> Audience Tech/Mobile
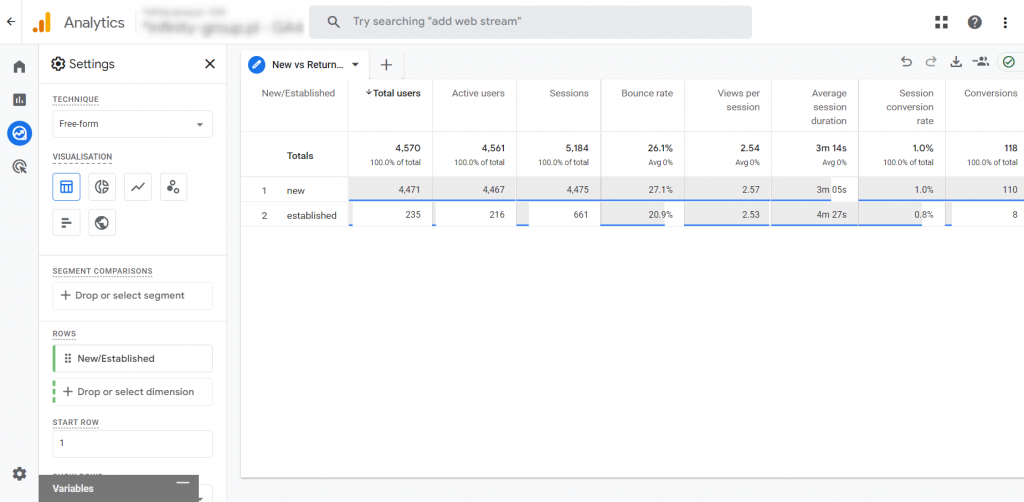
UA Audience -> Behaviour: New vs Returning in GA4
The report provides a comprehensive dataset that distinguishes between new and existing users, allowing businesses to conduct in-depth comparisons of key metrics. These metrics include total users, active users, session count, bounce rate, views per session, average session duration, per-session conversion rate, and total conversions. This approach empowers online businesses to gain insights into the effectiveness of their marketing strategies in attracting new customers and retaining existing ones, fostering brand loyalty. The ability to freely explore this data unveils hidden patterns in user behavior, enabling businesses to fine-tune their marketing strategies, enhance user engagement, and maximize return on investment.
Navigation
Go to the “Exploration” section -> Under “Start a new exploration,” click “Blank” template -> Select the following data in the configuration:
Dimensions (Lines):
- New/Established
Metrics (Values):
- Total users
- Users (Active users)
- Sessions
- Bounce rate
- Views per session
- Average session duration
- Session conversion rate
- Conversions
Method:
- Free-form
Exploration -> Audience Behaviour
UA Audience -> User flow in GA4
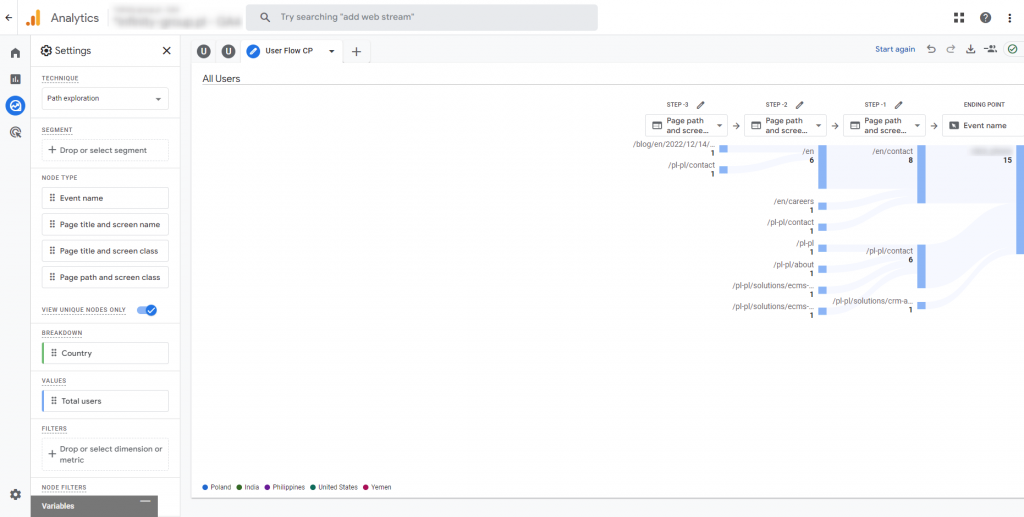
The report enables businesses to perform a thorough analysis of user journeys on their website. By utilizing dimensions like event name, page title, and screen name, in addition to page path and screen class, businesses can gain a detailed understanding of how users navigate through their site. The report also provides a geographical breakdown, along with metrics such as total users, active users, and the number of events, allowing businesses to identify which content is generating interest and which is causing users to drop off. Analyzing path sequences helps uncover traffic flow patterns, providing insights to enhance conversion paths and optimize content for improved user engagement and higher conversion rates.
Navigation
Go to “Exploration” -> Under “Start new exploration,” click “Empty” template -> In the configuration, select the following options:
Node type:
- Event name
- Page title and screen name
- Page title and screen class
- Page path and screen class
Dimensions (Division):
- Country
Metrics (Values):
- Total users
- Users (Active users)
- Event count
Method:
- Path exploration
Exploration -> Audience User Flow
By exploring the above report, we finish this guide on replicating the standard UA reports from the Audience section in Google Analytics 4. Stay connected with us on social media and stay tuned for the upcoming articles in this series. Soon, we will delve into the following sections: Acquisition, Behaviour and Conversions.


